Data
458,244 items of data are available, covering 210,856 participants.
Defined-instances run from 0 to 4, labelled using Instancing
1.
Units of measurement are mg.
| Maximum | 17.1165 |
| Decile 9 | 2.81618 |
| Decile 8 | 2.39156 |
| Decile 7 | 2.12424 |
| Decile 6 | 1.91638 |
| Median | 1.73387 |
| Decile 4 | 1.56383 |
| Decile 3 | 1.39567 |
| Decile 2 | 1.21308 |
| Decile 1 | 0.980818 |
| Minimum | 0 |
|

|
- Mean = 1.8519
- Std.dev = 0.826944
- 4076 items above graph maximum of 4.65154
|
5 Instances
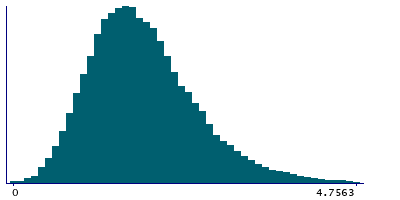
Instance 0 : Conducted in assessment centre, April 2009 to September 2010.
70,655 participants, 70,655 items
| Maximum | 17.1165 |
| Decile 9 | 2.84486 |
| Decile 8 | 2.40277 |
| Decile 7 | 2.11728 |
| Decile 6 | 1.90677 |
| Median | 1.71684 |
| Decile 4 | 1.54134 |
| Decile 3 | 1.36569 |
| Decile 2 | 1.17913 |
| Decile 1 | 0.933429 |
| Minimum | 0 |
|
|
- Mean = 1.8423
- Std.dev = 0.868535
- 671 items above graph maximum of 4.7563
|
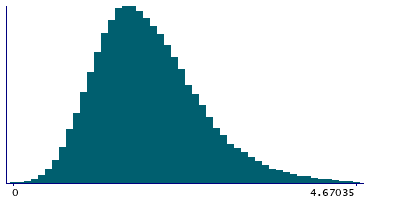
Instance 1 : On-line cycle 1, February 2011 to April 2011.
100,519 participants, 100,519 items
| Maximum | 13.6413 |
| Decile 9 | 2.83956 |
| Decile 8 | 2.42069 |
| Decile 7 | 2.156 |
| Decile 6 | 1.94876 |
| Median | 1.76313 |
| Decile 4 | 1.59326 |
| Decile 3 | 1.42439 |
| Decile 2 | 1.24127 |
| Decile 1 | 1.00878 |
| Minimum | 0 |
|
|
- Mean = 1.87798
- Std.dev = 0.816044
- 830 items above graph maximum of 4.67035
|
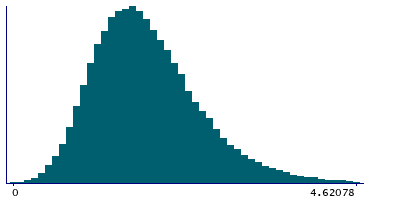
Instance 2 : On-line cycle 2, June 2011 to September 2011.
83,201 participants, 83,201 items
| Maximum | 12.6528 |
| Decile 9 | 2.7954 |
| Decile 8 | 2.37022 |
| Decile 7 | 2.10461 |
| Decile 6 | 1.89717 |
| Median | 1.71548 |
| Decile 4 | 1.54852 |
| Decile 3 | 1.37863 |
| Decile 2 | 1.1966 |
| Decile 1 | 0.970025 |
| Minimum | 0 |
|
|
- Mean = 1.83464
- Std.dev = 0.820033
- 748 items above graph maximum of 4.62078
|
Instance 3 : On-line cycle 3, October 2011 to December 2011.
103,700 participants, 103,700 items
| Maximum | 12.4565 |
| Decile 9 | 2.79677 |
| Decile 8 | 2.37893 |
| Decile 7 | 2.11682 |
| Decile 6 | 1.90935 |
| Median | 1.72925 |
| Decile 4 | 1.56092 |
| Decile 3 | 1.39528 |
| Decile 2 | 1.21495 |
| Decile 1 | 0.988006 |
| Minimum | 0 |
|

|
- Mean = 1.84542
- Std.dev = 0.815821
- 909 items above graph maximum of 4.60553
|
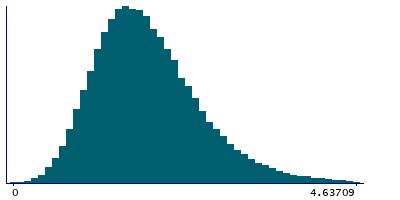
Instance 4 : On-line cycle 4, April 2012 to June 2012.
100,169 participants, 100,169 items
| Maximum | 15.523 |
| Decile 9 | 2.81246 |
| Decile 8 | 2.3875 |
| Decile 7 | 2.12118 |
| Decile 6 | 1.91498 |
| Median | 1.73471 |
| Decile 4 | 1.56647 |
| Decile 3 | 1.40016 |
| Decile 2 | 1.22074 |
| Decile 1 | 0.987837 |
| Minimum | 0 |
|
|
- Mean = 1.85355
- Std.dev = 0.824256
- 884 items above graph maximum of 4.63709
|
