Data
458,244 items of data are available, covering 210,856 participants.
Defined-instances run from 0 to 4, labelled using Instancing
1.
Units of measurement are mg.
| Maximum | 89.498 |
| Decile 9 | 14.6239 |
| Decile 8 | 12.6348 |
| Decile 7 | 11.2413 |
| Decile 6 | 10.1016 |
| Median | 9.1365 |
| Decile 4 | 8.28211 |
| Decile 3 | 7.45797 |
| Decile 2 | 6.59993 |
| Decile 1 | 5.50236 |
| Minimum | 0 |
|

|
- Mean = 9.74035
- Std.dev = 3.85733
- 2321 items above graph maximum of 23.7454
|
5 Instances
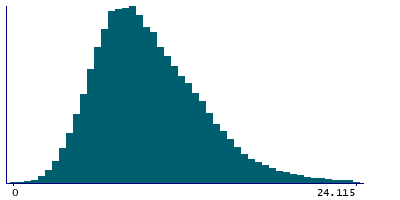
Instance 0 : Conducted in assessment centre, April 2009 to September 2010.
70,655 participants, 70,655 items
| Maximum | 87.2522 |
| Decile 9 | 14.6806 |
| Decile 8 | 12.6071 |
| Decile 7 | 11.1829 |
| Decile 6 | 10.0184 |
| Median | 9.03714 |
| Decile 4 | 8.16461 |
| Decile 3 | 7.29177 |
| Decile 2 | 6.39507 |
| Decile 1 | 5.24625 |
| Minimum | 0 |
|
|
- Mean = 9.64838
- Std.dev = 4.02642
- 390 items above graph maximum of 24.115
|
Instance 1 : On-line cycle 1, February 2011 to April 2011.
100,519 participants, 100,519 items
| Maximum | 73.6428 |
| Decile 9 | 14.7124 |
| Decile 8 | 12.7729 |
| Decile 7 | 11.3822 |
| Decile 6 | 10.238 |
| Median | 9.25509 |
| Decile 4 | 8.38849 |
| Decile 3 | 7.56726 |
| Decile 2 | 6.71292 |
| Decile 1 | 5.61243 |
| Minimum | 0 |
|

|
- Mean = 9.84574
- Std.dev = 3.81879
- 458 items above graph maximum of 23.8124
|
Instance 2 : On-line cycle 2, June 2011 to September 2011.
83,201 participants, 83,201 items
| Maximum | 89.498 |
| Decile 9 | 14.5293 |
| Decile 8 | 12.5224 |
| Decile 7 | 11.1078 |
| Decile 6 | 9.96949 |
| Median | 9.02473 |
| Decile 4 | 8.19036 |
| Decile 3 | 7.37496 |
| Decile 2 | 6.54266 |
| Decile 1 | 5.46516 |
| Minimum | 0 |
|

|
- Mean = 9.66013
- Std.dev = 3.86228
- 451 items above graph maximum of 23.5934
|
Instance 3 : On-line cycle 3, October 2011 to December 2011.
103,700 participants, 103,700 items
| Maximum | 69.0729 |
| Decile 9 | 14.6253 |
| Decile 8 | 12.6758 |
| Decile 7 | 11.3085 |
| Decile 6 | 10.1896 |
| Median | 9.21197 |
| Decile 4 | 8.35045 |
| Decile 3 | 7.52604 |
| Decile 2 | 6.6624 |
| Decile 1 | 5.56693 |
| Minimum | 0 |
|

|
- Mean = 9.78763
- Std.dev = 3.79613
- 488 items above graph maximum of 23.6836
|
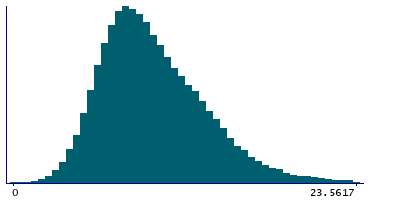
Instance 4 : On-line cycle 4, April 2012 to June 2012.
100,169 participants, 100,169 items
| Maximum | 76.3148 |
| Decile 9 | 14.5534 |
| Decile 8 | 12.5721 |
| Decile 7 | 11.1686 |
| Decile 6 | 10.0449 |
| Median | 9.09957 |
| Decile 4 | 8.26208 |
| Decile 3 | 7.46073 |
| Decile 2 | 6.61233 |
| Decile 1 | 5.54507 |
| Minimum | 0 |
|
|
- Mean = 9.71713
- Std.dev = 3.82928
- 533 items above graph maximum of 23.5617
|
