Data
458,244 items of data are available, covering 210,856 participants.
Defined-instances run from 0 to 4, labelled using Instancing
1.
Units of measurement are g.
| Maximum | 256.936 |
| Decile 9 | 42.9305 |
| Decile 8 | 35.7158 |
| Decile 7 | 31.1688 |
| Decile 6 | 27.6618 |
| Median | 24.6329 |
| Decile 4 | 21.834 |
| Decile 3 | 19.0733 |
| Decile 2 | 16.1077 |
| Decile 1 | 12.4571 |
| Minimum | 0 |
|

|
- Mean = 26.5912
- Std.dev = 12.7952
- 2407 items above graph maximum of 73.4038
|
5 Instances
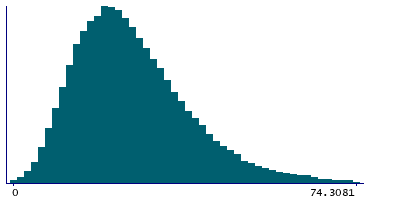
Instance 0 : Conducted in assessment centre, April 2009 to September 2010.
70,655 participants, 70,655 items
| Maximum | 219.345 |
| Decile 9 | 42.9778 |
| Decile 8 | 35.5086 |
| Decile 7 | 30.8024 |
| Decile 6 | 27.0941 |
| Median | 23.9807 |
| Decile 4 | 21.1322 |
| Decile 3 | 18.3201 |
| Decile 2 | 15.3103 |
| Decile 1 | 11.6474 |
| Minimum | 0 |
|
|
- Mean = 26.1209
- Std.dev = 13.2669
- 417 items above graph maximum of 74.3081
|
Instance 1 : On-line cycle 1, February 2011 to April 2011.
100,519 participants, 100,519 items
| Maximum | 207.386 |
| Decile 9 | 42.866 |
| Decile 8 | 35.7375 |
| Decile 7 | 31.2775 |
| Decile 6 | 27.7551 |
| Median | 24.7566 |
| Decile 4 | 21.9691 |
| Decile 3 | 19.254 |
| Decile 2 | 16.2978 |
| Decile 1 | 12.6394 |
| Minimum | 0 |
|

|
- Mean = 26.6754
- Std.dev = 12.6287
- 495 items above graph maximum of 73.0925
|
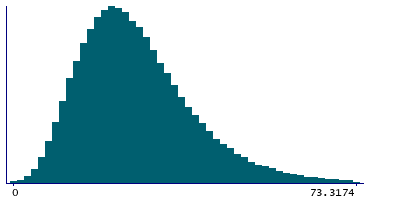
Instance 2 : On-line cycle 2, June 2011 to September 2011.
83,201 participants, 83,201 items
| Maximum | 256.199 |
| Decile 9 | 42.887 |
| Decile 8 | 35.6454 |
| Decile 7 | 31.0876 |
| Decile 6 | 27.6019 |
| Median | 24.5878 |
| Decile 4 | 21.7989 |
| Decile 3 | 19.0638 |
| Decile 2 | 16.1123 |
| Decile 1 | 12.4566 |
| Minimum | 0 |
|
|
- Mean = 26.5631
- Std.dev = 12.7678
- 428 items above graph maximum of 73.3174
|
Instance 3 : On-line cycle 3, October 2011 to December 2011.
103,700 participants, 103,700 items
| Maximum | 175.461 |
| Decile 9 | 42.4958 |
| Decile 8 | 35.4235 |
| Decile 7 | 30.9747 |
| Decile 6 | 27.5635 |
| Median | 24.5814 |
| Decile 4 | 21.8023 |
| Decile 3 | 19.0859 |
| Decile 2 | 16.1471 |
| Decile 1 | 12.5969 |
| Minimum | 0 |
|

|
- Mean = 26.4634
- Std.dev = 12.5
- 527 items above graph maximum of 72.3946
|
Instance 4 : On-line cycle 4, April 2012 to June 2012.
100,169 participants, 100,169 items
| Maximum | 256.936 |
| Decile 9 | 43.4498 |
| Decile 8 | 36.1786 |
| Decile 7 | 31.5941 |
| Decile 6 | 28.0544 |
| Median | 25.0469 |
| Decile 4 | 22.2347 |
| Decile 3 | 19.4114 |
| Decile 2 | 16.4531 |
| Decile 1 | 12.7418 |
| Minimum | 0 |
|

|
- Mean = 26.9943
- Std.dev = 12.9331
- 538 items above graph maximum of 74.1577
|
