Data
458,244 items of data are available, covering 210,856 participants.
Defined-instances run from 0 to 4, labelled using Instancing
1.
Units of measurement are mg.
| Maximum | 116.042 |
| Decile 9 | 17.9306 |
| Decile 8 | 14.8863 |
| Decile 7 | 12.9552 |
| Decile 6 | 11.4477 |
| Median | 10.1628 |
| Decile 4 | 8.99197 |
| Decile 3 | 7.83631 |
| Decile 2 | 6.60132 |
| Decile 1 | 5.1176 |
| Minimum | 0 |
|

|
- Mean = 11.0084
- Std.dev = 5.31555
- 2071 items above graph maximum of 30.7436
|
5 Instances
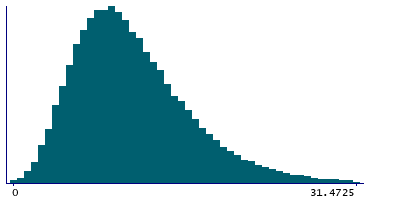
Instance 0 : Conducted in assessment centre, April 2009 to September 2010.
70,655 participants, 70,655 items
| Maximum | 114.941 |
| Decile 9 | 18.1974 |
| Decile 8 | 15.0505 |
| Decile 7 | 13.0055 |
| Decile 6 | 11.4308 |
| Median | 10.0926 |
| Decile 4 | 8.90127 |
| Decile 3 | 7.70196 |
| Decile 2 | 6.4498 |
| Decile 1 | 4.92219 |
| Minimum | 0 |
|
|
- Mean = 11.0123
- Std.dev = 5.54304
- 324 items above graph maximum of 31.4725
|
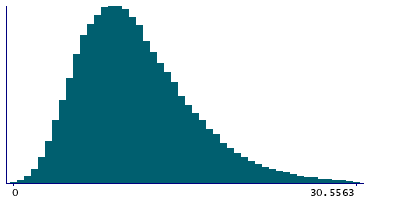
Instance 1 : On-line cycle 1, February 2011 to April 2011.
100,519 participants, 100,519 items
| Maximum | 80.2727 |
| Decile 9 | 17.8824 |
| Decile 8 | 14.8865 |
| Decile 7 | 12.9869 |
| Decile 6 | 11.4726 |
| Median | 10.2178 |
| Decile 4 | 9.06366 |
| Decile 3 | 7.90811 |
| Decile 2 | 6.67086 |
| Decile 1 | 5.20854 |
| Minimum | 0 |
|
|
- Mean = 11.0416
- Std.dev = 5.25701
- 448 items above graph maximum of 30.5563
|
Instance 2 : On-line cycle 2, June 2011 to September 2011.
83,201 participants, 83,201 items
| Maximum | 116.042 |
| Decile 9 | 18.2154 |
| Decile 8 | 15.1263 |
| Decile 7 | 13.1892 |
| Decile 6 | 11.6395 |
| Median | 10.3246 |
| Decile 4 | 9.12105 |
| Decile 3 | 7.9495 |
| Decile 2 | 6.70161 |
| Decile 1 | 5.21169 |
| Minimum | 0 |
|

|
- Mean = 11.1813
- Std.dev = 5.37572
- 357 items above graph maximum of 31.2192
|
Instance 3 : On-line cycle 3, October 2011 to December 2011.
103,700 participants, 103,700 items
| Maximum | 68.3375 |
| Decile 9 | 17.3497 |
| Decile 8 | 14.3707 |
| Decile 7 | 12.526 |
| Decile 6 | 11.094 |
| Median | 9.86304 |
| Decile 4 | 8.73888 |
| Decile 3 | 7.64361 |
| Decile 2 | 6.46411 |
| Decile 1 | 5.02525 |
| Minimum | 0 |
|

|
- Mean = 10.6779
- Std.dev = 5.09829
- 461 items above graph maximum of 29.6741
|
Instance 4 : On-line cycle 4, April 2012 to June 2012.
100,169 participants, 100,169 items
| Maximum | 98.7836 |
| Decile 9 | 18.1335 |
| Decile 8 | 15.1107 |
| Decile 7 | 13.1606 |
| Decile 6 | 11.6338 |
| Median | 10.3414 |
| Decile 4 | 9.14727 |
| Decile 3 | 7.96897 |
| Decile 2 | 6.71743 |
| Decile 1 | 5.19759 |
| Minimum | 0 |
|

|
- Mean = 11.1708
- Std.dev = 5.36433
- 466 items above graph maximum of 31.0694
|
