Data
458,244 items of data are available, covering 210,856 participants.
Defined-instances run from 0 to 4, labelled using Instancing
1.
Units of measurement are ug.
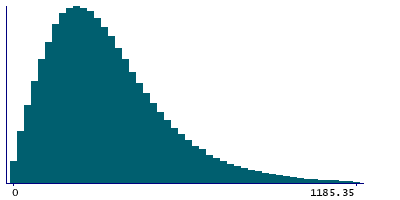
| Maximum | 39093.9 |
| Decile 9 | 642.681 |
| Decile 8 | 492.587 |
| Decile 7 | 407.685 |
| Decile 6 | 345.396 |
| Median | 293.507 |
| Decile 4 | 246.691 |
| Decile 3 | 201.316 |
| Decile 2 | 154.758 |
| Decile 1 | 100.013 |
| Minimum | 0 |
|
|
- Mean = 475.784
- Std.dev = 1138.22
- 11278 items above graph maximum of 1185.35
|
5 Instances
Instance 0 : Conducted in assessment centre, April 2009 to September 2010.
70,655 participants, 70,655 items
| Maximum | 38736.5 |
| Decile 9 | 629.205 |
| Decile 8 | 482.873 |
| Decile 7 | 398.708 |
| Decile 6 | 337.47 |
| Median | 285.707 |
| Decile 4 | 239.1 |
| Decile 3 | 194.192 |
| Decile 2 | 147.938 |
| Decile 1 | 93.1132 |
| Minimum | 0 |
|

|
- Mean = 442.748
- Std.dev = 1058.24
- 1500 items above graph maximum of 1165.3
|
Instance 1 : On-line cycle 1, February 2011 to April 2011.
100,519 participants, 100,519 items
| Maximum | 39093.9 |
| Decile 9 | 640.778 |
| Decile 8 | 492.916 |
| Decile 7 | 408.364 |
| Decile 6 | 345.81 |
| Median | 294.326 |
| Decile 4 | 247.316 |
| Decile 3 | 201.956 |
| Decile 2 | 154.875 |
| Decile 1 | 100.343 |
| Minimum | 0 |
|

|
- Mean = 483.258
- Std.dev = 1157.73
- 2630 items above graph maximum of 1181.21
|
Instance 2 : On-line cycle 2, June 2011 to September 2011.
83,201 participants, 83,201 items
| Maximum | 38939.2 |
| Decile 9 | 639.997 |
| Decile 8 | 490.475 |
| Decile 7 | 406.4 |
| Decile 6 | 344.218 |
| Median | 292.549 |
| Decile 4 | 246.232 |
| Decile 3 | 200.899 |
| Decile 2 | 154.919 |
| Decile 1 | 100.386 |
| Minimum | 0 |
|

|
- Mean = 474.254
- Std.dev = 1150.31
- 2028 items above graph maximum of 1179.61
|
Instance 3 : On-line cycle 3, October 2011 to December 2011.
103,700 participants, 103,700 items
| Maximum | 38496.2 |
| Decile 9 | 647.052 |
| Decile 8 | 494.074 |
| Decile 7 | 408.151 |
| Decile 6 | 345.49 |
| Median | 293.3 |
| Decile 4 | 247.477 |
| Decile 3 | 202.215 |
| Decile 2 | 156.245 |
| Decile 1 | 101.864 |
| Minimum | 0 |
|

|
- Mean = 487.729
- Std.dev = 1172.63
- 2632 items above graph maximum of 1192.24
|
Instance 4 : On-line cycle 4, April 2012 to June 2012.
100,169 participants, 100,169 items
| Maximum | 38956.1 |
| Decile 9 | 651.251 |
| Decile 8 | 498.982 |
| Decile 7 | 413.582 |
| Decile 6 | 351.691 |
| Median | 299.287 |
| Decile 4 | 251.353 |
| Decile 3 | 205.187 |
| Decile 2 | 158.012 |
| Decile 1 | 102.591 |
| Minimum | 0 |
|

|
- Mean = 480.491
- Std.dev = 1126.15
- 2481 items above graph maximum of 1199.91
|
