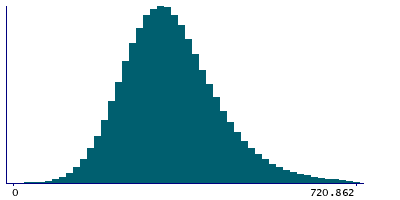
Data
458,244 items of data are available, covering 210,856 participants.
Defined-instances run from 0 to 4, labelled using Instancing
1.
Units of measurement are mg.
| Maximum | 3026.25 |
| Decile 9 | 466.223 |
| Decile 8 | 410.898 |
| Decile 7 | 375.594 |
| Decile 6 | 347.744 |
| Median | 323.313 |
| Decile 4 | 299.768 |
| Decile 3 | 275.521 |
| Decile 2 | 248.194 |
| Decile 1 | 211.585 |
| Minimum | 0 |
|
|
- Mean = 333.685
- Std.dev = 106.615
- 2021 items above graph maximum of 720.862
|
5 Instances
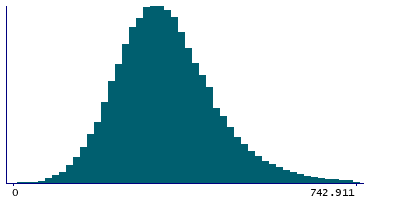
Instance 0 : Conducted in assessment centre, April 2009 to September 2010.
70,655 participants, 70,655 items
| Maximum | 3026.25 |
| Decile 9 | 473.323 |
| Decile 8 | 414.865 |
| Decile 7 | 377.67 |
| Decile 6 | 348.167 |
| Median | 322.37 |
| Decile 4 | 297.179 |
| Decile 3 | 271.412 |
| Decile 2 | 242.595 |
| Decile 1 | 203.735 |
| Minimum | 0 |
|
|
- Mean = 333.407
- Std.dev = 114.401
- 345 items above graph maximum of 742.911
|
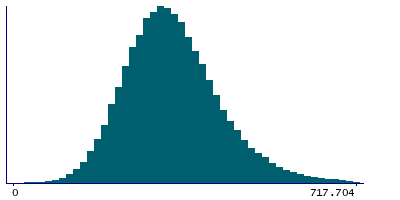
Instance 1 : On-line cycle 1, February 2011 to April 2011.
100,519 participants, 100,519 items
| Maximum | 1792.33 |
| Decile 9 | 465.965 |
| Decile 8 | 411.408 |
| Decile 7 | 377.029 |
| Decile 6 | 349.541 |
| Median | 325.299 |
| Decile 4 | 302.088 |
| Decile 3 | 277.966 |
| Decile 2 | 250.433 |
| Decile 1 | 214.226 |
| Minimum | 0 |
|
|
- Mean = 335.159
- Std.dev = 104.725
- 402 items above graph maximum of 717.704
|
Instance 2 : On-line cycle 2, June 2011 to September 2011.
83,201 participants, 83,201 items
| Maximum | 2588.76 |
| Decile 9 | 464.964 |
| Decile 8 | 409.826 |
| Decile 7 | 374.826 |
| Decile 6 | 347.132 |
| Median | 323.072 |
| Decile 4 | 299.47 |
| Decile 3 | 275.542 |
| Decile 2 | 248.653 |
| Decile 1 | 212.631 |
| Minimum | 0 |
|

|
- Mean = 333.326
- Std.dev = 105.869
- 371 items above graph maximum of 717.296
|
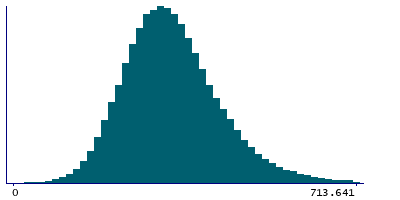
Instance 3 : On-line cycle 3, October 2011 to December 2011.
103,700 participants, 103,700 items
| Maximum | 1954.86 |
| Decile 9 | 462.519 |
| Decile 8 | 408.126 |
| Decile 7 | 372.919 |
| Decile 6 | 345.439 |
| Median | 321.25 |
| Decile 4 | 298.084 |
| Decile 3 | 274.127 |
| Decile 2 | 247.453 |
| Decile 1 | 211.396 |
| Minimum | 0 |
|
|
- Mean = 331.599
- Std.dev = 104.014
- 394 items above graph maximum of 713.641
|
Instance 4 : On-line cycle 4, April 2012 to June 2012.
100,169 participants, 100,169 items
| Maximum | 2428.99 |
| Decile 9 | 466.414 |
| Decile 8 | 411.368 |
| Decile 7 | 376.165 |
| Decile 6 | 348.414 |
| Median | 324.234 |
| Decile 4 | 301.201 |
| Decile 3 | 277.267 |
| Decile 2 | 250.033 |
| Decile 1 | 213.782 |
| Minimum | 0 |
|

|
- Mean = 334.858
- Std.dev = 106.04
- 474 items above graph maximum of 719.046
|
