Data
458,244 items of data are available, covering 210,856 participants.
Defined-instances run from 0 to 4, labelled using Instancing
1.
Units of measurement are ug.
| Maximum | 2773.73 |
| Decile 9 | 464.497 |
| Decile 8 | 401.064 |
| Decile 7 | 360.013 |
| Decile 6 | 327.704 |
| Median | 299.01 |
| Decile 4 | 271.768 |
| Decile 3 | 244.135 |
| Decile 2 | 213.48 |
| Decile 1 | 173.774 |
| Minimum | 0 |
|

|
- Mean = 312.196
- Std.dev = 120.286
- 1794 items above graph maximum of 755.22
|
5 Instances
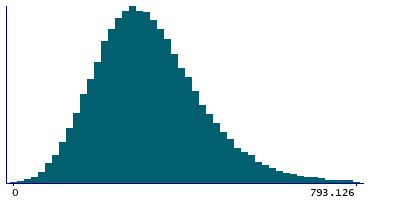
Instance 0 : Conducted in assessment centre, April 2009 to September 2010.
70,655 participants, 70,655 items
| Maximum | 2773.73 |
| Decile 9 | 480.541 |
| Decile 8 | 412.043 |
| Decile 7 | 368.039 |
| Decile 6 | 333.566 |
| Median | 302.946 |
| Decile 4 | 273.618 |
| Decile 3 | 244.105 |
| Decile 2 | 211.244 |
| Decile 1 | 167.956 |
| Minimum | 0 |
|
|
- Mean = 317.29
- Std.dev = 130.231
- 308 items above graph maximum of 793.126
|
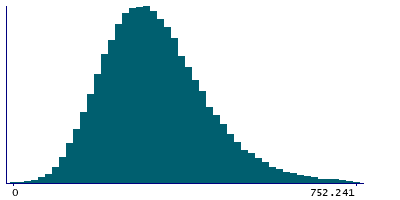
Instance 1 : On-line cycle 1, February 2011 to April 2011.
100,519 participants, 100,519 items
| Maximum | 1923.19 |
| Decile 9 | 464.145 |
| Decile 8 | 401.813 |
| Decile 7 | 360.814 |
| Decile 6 | 328.909 |
| Median | 300.29 |
| Decile 4 | 273.022 |
| Decile 3 | 245.403 |
| Decile 2 | 215.372 |
| Decile 1 | 176.05 |
| Minimum | 0 |
|
|
- Mean = 313.294
- Std.dev = 118.996
- 364 items above graph maximum of 752.241
|
Instance 2 : On-line cycle 2, June 2011 to September 2011.
83,201 participants, 83,201 items
| Maximum | 2320.36 |
| Decile 9 | 462.106 |
| Decile 8 | 399.972 |
| Decile 7 | 359.745 |
| Decile 6 | 327.325 |
| Median | 298.779 |
| Decile 4 | 271.775 |
| Decile 3 | 244.102 |
| Decile 2 | 213.396 |
| Decile 1 | 174.193 |
| Minimum | 0 |
|

|
- Mean = 311.556
- Std.dev = 118.806
- 316 items above graph maximum of 750.019
|
Instance 3 : On-line cycle 3, October 2011 to December 2011.
103,700 participants, 103,700 items
| Maximum | 2044.83 |
| Decile 9 | 457.815 |
| Decile 8 | 395.452 |
| Decile 7 | 355.043 |
| Decile 6 | 323.183 |
| Median | 294.872 |
| Decile 4 | 268.45 |
| Decile 3 | 241.41 |
| Decile 2 | 211.209 |
| Decile 1 | 172.775 |
| Minimum | 0 |
|

|
- Mean = 308.226
- Std.dev = 117.675
- 400 items above graph maximum of 742.856
|
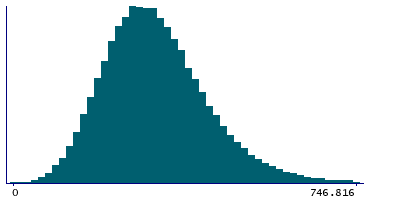
Instance 4 : On-line cycle 4, April 2012 to June 2012.
100,169 participants, 100,169 items
| Maximum | 2446.92 |
| Decile 9 | 461.476 |
| Decile 8 | 399.111 |
| Decile 7 | 359.07 |
| Decile 6 | 327.675 |
| Median | 299.775 |
| Decile 4 | 272.726 |
| Decile 3 | 245.709 |
| Decile 2 | 215.595 |
| Decile 1 | 176.136 |
| Minimum | 0 |
|
|
- Mean = 312.142
- Std.dev = 117.99
- 391 items above graph maximum of 746.816
|
