Data
458,244 items of data are available, covering 210,856 participants.
Defined-instances run from 0 to 4, labelled using Instancing
1.
Units of measurement are mg.
| Maximum | 19.1981 |
| Decile 9 | 3.03961 |
| Decile 8 | 2.62247 |
| Decile 7 | 2.36208 |
| Decile 6 | 2.15709 |
| Median | 1.97623 |
| Decile 4 | 1.80342 |
| Decile 3 | 1.62524 |
| Decile 2 | 1.42639 |
| Decile 1 | 1.16226 |
| Minimum | 0 |
|
|
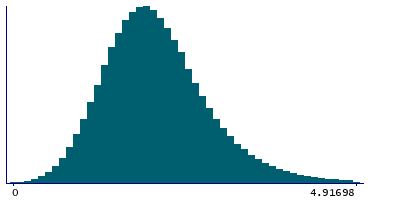
- Mean = 2.05769
- Std.dev = 0.777637
- 1809 items above graph maximum of 4.91696
|
5 Instances
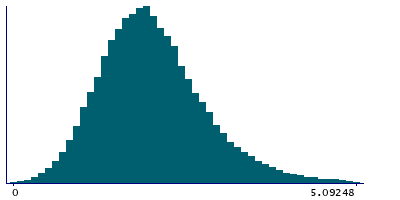
Instance 0 : Conducted in assessment centre, April 2009 to September 2010.
70,655 participants, 70,655 items
| Maximum | 19.1981 |
| Decile 9 | 3.11399 |
| Decile 8 | 2.67296 |
| Decile 7 | 2.39414 |
| Decile 6 | 2.1818 |
| Median | 1.99079 |
| Decile 4 | 1.81324 |
| Decile 3 | 1.62436 |
| Decile 2 | 1.41555 |
| Decile 1 | 1.1355 |
| Minimum | 0 |
|
|
- Mean = 2.08016
- Std.dev = 0.824503
- 299 items above graph maximum of 5.09248
|
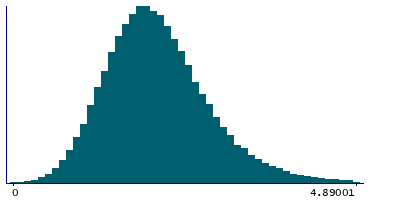
Instance 1 : On-line cycle 1, February 2011 to April 2011.
100,519 participants, 100,519 items
| Maximum | 12.2394 |
| Decile 9 | 3.03401 |
| Decile 8 | 2.62738 |
| Decile 7 | 2.36871 |
| Decile 6 | 2.16491 |
| Median | 1.98636 |
| Decile 4 | 1.81484 |
| Decile 3 | 1.63853 |
| Decile 2 | 1.44027 |
| Decile 1 | 1.17801 |
| Minimum | 0 |
|
|
- Mean = 2.06461
- Std.dev = 0.765507
- 366 items above graph maximum of 4.89001
|
Instance 2 : On-line cycle 2, June 2011 to September 2011.
83,201 participants, 83,201 items
| Maximum | 17.3867 |
| Decile 9 | 3.04384 |
| Decile 8 | 2.62211 |
| Decile 7 | 2.36109 |
| Decile 6 | 2.15495 |
| Median | 1.97193 |
| Decile 4 | 1.79786 |
| Decile 3 | 1.61639 |
| Decile 2 | 1.41942 |
| Decile 1 | 1.15551 |
| Minimum | 0 |
|

|
- Mean = 2.05418
- Std.dev = 0.781322
- 336 items above graph maximum of 4.93216
|
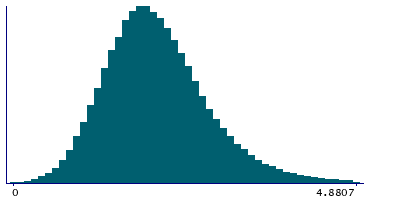
Instance 3 : On-line cycle 3, October 2011 to December 2011.
103,700 participants, 103,700 items
| Maximum | 13.2895 |
| Decile 9 | 3.00481 |
| Decile 8 | 2.60002 |
| Decile 7 | 2.34303 |
| Decile 6 | 2.14278 |
| Median | 1.96479 |
| Decile 4 | 1.79375 |
| Decile 3 | 1.61851 |
| Decile 2 | 1.42186 |
| Decile 1 | 1.16508 |
| Minimum | 0 |
|

|
- Mean = 2.04282
- Std.dev = 0.760311
- 379 items above graph maximum of 4.84454
|
Instance 4 : On-line cycle 4, April 2012 to June 2012.
100,169 participants, 100,169 items
| Maximum | 13.0359 |
| Decile 9 | 3.02484 |
| Decile 8 | 2.60997 |
| Decile 7 | 2.35383 |
| Decile 6 | 2.15091 |
| Median | 1.97009 |
| Decile 4 | 1.79961 |
| Decile 3 | 1.62672 |
| Decile 2 | 1.43002 |
| Decile 1 | 1.16898 |
| Minimum | 0 |
|
|
- Mean = 2.05321
- Std.dev = 0.769862
- 409 items above graph maximum of 4.8807
|
