Data
458,244 items of data are available, covering 210,856 participants.
Defined-instances run from 0 to 4, labelled using Instancing
1.
Units of measurement are mg.
| Maximum | 119.51 |
| Decile 9 | 17.8929 |
| Decile 8 | 15.6438 |
| Decile 7 | 14.174 |
| Decile 6 | 13.0014 |
| Median | 11.9647 |
| Decile 4 | 10.9694 |
| Decile 3 | 9.95467 |
| Decile 2 | 8.81115 |
| Decile 1 | 7.28796 |
| Minimum | 0 |
|

|
- Mean = 12.3788
- Std.dev = 4.36711
- 1569 items above graph maximum of 28.4979
|
5 Instances
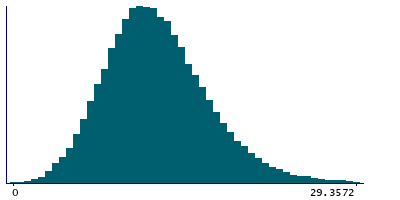
Instance 0 : Conducted in assessment centre, April 2009 to September 2010.
70,655 participants, 70,655 items
| Maximum | 119.51 |
| Decile 9 | 18.1603 |
| Decile 8 | 15.8077 |
| Decile 7 | 14.2539 |
| Decile 6 | 13.0252 |
| Median | 11.9173 |
| Decile 4 | 10.8538 |
| Decile 3 | 9.78393 |
| Decile 2 | 8.57969 |
| Decile 1 | 6.96338 |
| Minimum | 0 |
|
|
- Mean = 12.3537
- Std.dev = 4.64755
- 268 items above graph maximum of 29.3572
|
Instance 1 : On-line cycle 1, February 2011 to April 2011.
100,519 participants, 100,519 items
| Maximum | 64.2271 |
| Decile 9 | 17.8574 |
| Decile 8 | 15.6716 |
| Decile 7 | 14.209 |
| Decile 6 | 13.0401 |
| Median | 12.0064 |
| Decile 4 | 11.0209 |
| Decile 3 | 10.0156 |
| Decile 2 | 8.89014 |
| Decile 1 | 7.39491 |
| Minimum | 0 |
|

|
- Mean = 12.4212
- Std.dev = 4.30305
- 320 items above graph maximum of 28.3199
|
Instance 2 : On-line cycle 2, June 2011 to September 2011.
83,201 participants, 83,201 items
| Maximum | 94.9035 |
| Decile 9 | 17.9763 |
| Decile 8 | 15.7012 |
| Decile 7 | 14.2301 |
| Decile 6 | 13.0615 |
| Median | 12.0314 |
| Decile 4 | 11.0465 |
| Decile 3 | 10.0289 |
| Decile 2 | 8.88669 |
| Decile 1 | 7.36608 |
| Minimum | 0 |
|

|
- Mean = 12.4536
- Std.dev = 4.35832
- 281 items above graph maximum of 28.5866
|
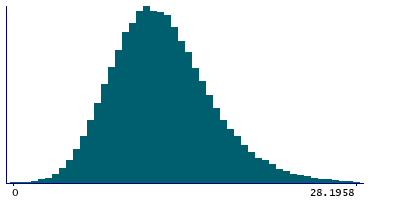
Instance 3 : On-line cycle 3, October 2011 to December 2011.
103,700 participants, 103,700 items
| Maximum | 80.3317 |
| Decile 9 | 17.7419 |
| Decile 8 | 15.5127 |
| Decile 7 | 14.078 |
| Decile 6 | 12.9209 |
| Median | 11.9103 |
| Decile 4 | 10.9124 |
| Decile 3 | 9.91598 |
| Decile 2 | 8.78498 |
| Decile 1 | 7.2881 |
| Minimum | 0 |
|
|
- Mean = 12.3026
- Std.dev = 4.27268
- 329 items above graph maximum of 28.1958
|
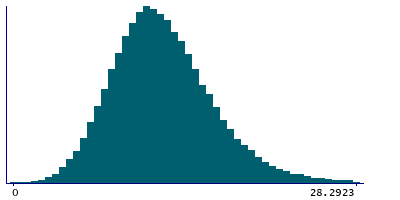
Instance 4 : On-line cycle 4, April 2012 to June 2012.
100,169 participants, 100,169 items
| Maximum | 93.8213 |
| Decile 9 | 17.8158 |
| Decile 8 | 15.5956 |
| Decile 7 | 14.1371 |
| Decile 6 | 12.9811 |
| Median | 11.9515 |
| Decile 4 | 10.9769 |
| Decile 3 | 9.98106 |
| Decile 2 | 8.85777 |
| Decile 1 | 7.33921 |
| Minimum | 0 |
|
|
- Mean = 12.3707
- Std.dev = 4.32913
- 356 items above graph maximum of 28.2923
|
