Data
458,244 items of data are available, covering 210,856 participants.
Defined-instances run from 0 to 4, labelled using Instancing
1.
Units of measurement are mg.
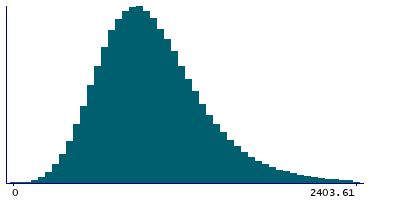
| Maximum | 7946.36 |
| Decile 9 | 1474.71 |
| Decile 8 | 1261.76 |
| Decile 7 | 1127.98 |
| Decile 6 | 1024.04 |
| Median | 932.619 |
| Decile 4 | 847.409 |
| Decile 3 | 760.84 |
| Decile 2 | 666.691 |
| Decile 1 | 545.817 |
| Minimum | 0 |
|
|
- Mean = 983.176
- Std.dev = 389.091
- 2298 items above graph maximum of 2403.61
|
5 Instances
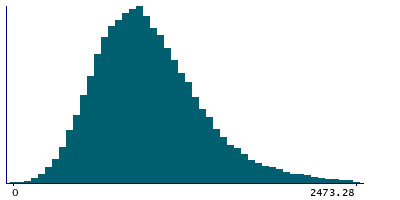
Instance 0 : Conducted in assessment centre, April 2009 to September 2010.
70,655 participants, 70,655 items
| Maximum | 7946.36 |
| Decile 9 | 1503.15 |
| Decile 8 | 1279.48 |
| Decile 7 | 1141.41 |
| Decile 6 | 1031.77 |
| Median | 935.806 |
| Decile 4 | 848.104 |
| Decile 3 | 756.6 |
| Decile 2 | 657.788 |
| Decile 1 | 533.032 |
| Minimum | 0 |
|
|
- Mean = 990.583
- Std.dev = 410.584
- 398 items above graph maximum of 2473.28
|
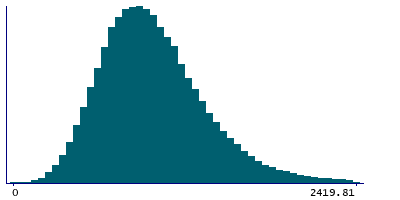
Instance 1 : On-line cycle 1, February 2011 to April 2011.
100,519 participants, 100,519 items
| Maximum | 5378.66 |
| Decile 9 | 1487.49 |
| Decile 8 | 1275.22 |
| Decile 7 | 1140.04 |
| Decile 6 | 1035.61 |
| Median | 944.074 |
| Decile 4 | 857.415 |
| Decile 3 | 770.398 |
| Decile 2 | 676.997 |
| Decile 1 | 555.177 |
| Minimum | 0 |
|
|
- Mean = 993.576
- Std.dev = 387.93
- 475 items above graph maximum of 2419.81
|
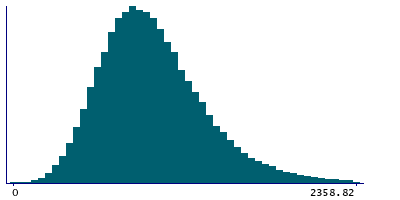
Instance 2 : On-line cycle 2, June 2011 to September 2011.
83,201 participants, 83,201 items
| Maximum | 5902.6 |
| Decile 9 | 1449.47 |
| Decile 8 | 1240.56 |
| Decile 7 | 1108.05 |
| Decile 6 | 1005.67 |
| Median | 917.031 |
| Decile 4 | 833.236 |
| Decile 3 | 749.67 |
| Decile 2 | 658.539 |
| Decile 1 | 540.119 |
| Minimum | 0 |
|
|
- Mean = 967.413
- Std.dev = 380.687
- 449 items above graph maximum of 2358.82
|
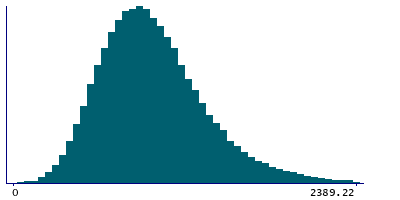
Instance 3 : On-line cycle 3, October 2011 to December 2011.
103,700 participants, 103,700 items
| Maximum | 5003.64 |
| Decile 9 | 1467.04 |
| Decile 8 | 1256.13 |
| Decile 7 | 1123.59 |
| Decile 6 | 1021.5 |
| Median | 930.923 |
| Decile 4 | 846.002 |
| Decile 3 | 759.019 |
| Decile 2 | 664.347 |
| Decile 1 | 544.847 |
| Minimum | 0 |
|
|
- Mean = 979.157
- Std.dev = 383.96
- 488 items above graph maximum of 2389.22
|
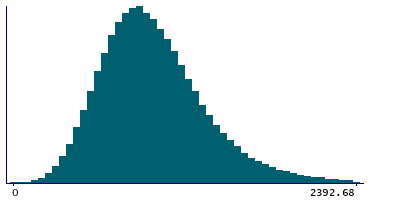
Instance 4 : On-line cycle 4, April 2012 to June 2012.
100,169 participants, 100,169 items
| Maximum | 6505.66 |
| Decile 9 | 1471.85 |
| Decile 8 | 1258.96 |
| Decile 7 | 1127.68 |
| Decile 6 | 1024.85 |
| Median | 934.233 |
| Decile 4 | 850.398 |
| Decile 3 | 765.297 |
| Decile 2 | 671.884 |
| Decile 1 | 551.015 |
| Minimum | 0 |
|
|
- Mean = 984.768
- Std.dev = 386.369
- 495 items above graph maximum of 2392.68
|
