Data
458,244 items of data are available, covering 210,856 participants.
Defined-instances run from 0 to 4, labelled using Instancing
1.
Units of measurement are g.
| Maximum | 23.7716 |
| Decile 9 | 3.63241 |
| Decile 8 | 2.81701 |
| Decile 7 | 2.29806 |
| Decile 6 | 1.9618 |
| Median | 1.70082 |
| Decile 4 | 1.47564 |
| Decile 3 | 1.26666 |
| Decile 2 | 1.0547 |
| Decile 1 | 0.807185 |
| Minimum | 0 |
|

|
- Mean = 2.00013
- Std.dev = 1.20967
- 3194 items above graph maximum of 6.45764
|
5 Instances
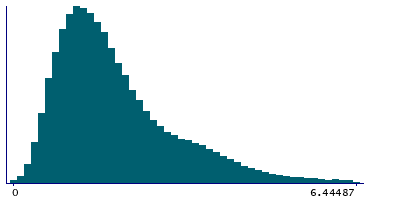
Instance 0 : Conducted in assessment centre, April 2009 to September 2010.
70,655 participants, 70,655 items
| Maximum | 22.1697 |
| Decile 9 | 3.60431 |
| Decile 8 | 2.77788 |
| Decile 7 | 2.2655 |
| Decile 6 | 1.92325 |
| Median | 1.66251 |
| Decile 4 | 1.43552 |
| Decile 3 | 1.22394 |
| Decile 2 | 1.01378 |
| Decile 1 | 0.763743 |
| Minimum | 0 |
|
|
- Mean = 1.96342
- Std.dev = 1.22247
- 507 items above graph maximum of 6.44487
|
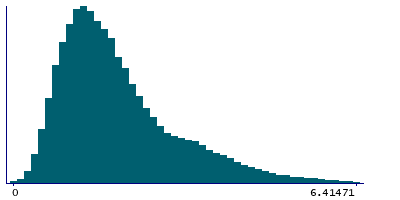
Instance 1 : On-line cycle 1, February 2011 to April 2011.
100,519 participants, 100,519 items
| Maximum | 16.771 |
| Decile 9 | 3.61908 |
| Decile 8 | 2.80244 |
| Decile 7 | 2.29664 |
| Decile 6 | 1.96688 |
| Median | 1.71246 |
| Decile 4 | 1.48744 |
| Decile 3 | 1.2817 |
| Decile 2 | 1.07248 |
| Decile 1 | 0.823454 |
| Minimum | 0 |
|
|
- Mean = 2.00495
- Std.dev = 1.19826
- 730 items above graph maximum of 6.41471
|
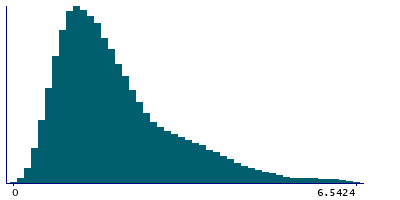
Instance 2 : On-line cycle 2, June 2011 to September 2011.
83,201 participants, 83,201 items
| Maximum | 23.7716 |
| Decile 9 | 3.67334 |
| Decile 8 | 2.85419 |
| Decile 7 | 2.31697 |
| Decile 6 | 1.96883 |
| Median | 1.69884 |
| Decile 4 | 1.46964 |
| Decile 3 | 1.25603 |
| Decile 2 | 1.04701 |
| Decile 1 | 0.804282 |
| Minimum | 0 |
|
|
- Mean = 2.0123
- Std.dev = 1.23706
- 604 items above graph maximum of 6.5424
|
Instance 3 : On-line cycle 3, October 2011 to December 2011.
103,700 participants, 103,700 items
| Maximum | 16.0276 |
| Decile 9 | 3.53803 |
| Decile 8 | 2.73797 |
| Decile 7 | 2.2512 |
| Decile 6 | 1.93397 |
| Median | 1.68526 |
| Decile 4 | 1.47024 |
| Decile 3 | 1.26909 |
| Decile 2 | 1.05972 |
| Decile 1 | 0.812945 |
| Minimum | 0 |
|

|
- Mean = 1.96548
- Std.dev = 1.15637
- 727 items above graph maximum of 6.26312
|
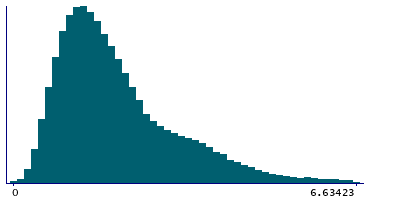
Instance 4 : On-line cycle 4, April 2012 to June 2012.
100,169 participants, 100,169 items
| Maximum | 18.3896 |
| Decile 9 | 3.72682 |
| Decile 8 | 2.91241 |
| Decile 7 | 2.35799 |
| Decile 6 | 2.00931 |
| Median | 1.73741 |
| Decile 4 | 1.50391 |
| Decile 3 | 1.28769 |
| Decile 2 | 1.07028 |
| Decile 1 | 0.819414 |
| Minimum | 0 |
|
|
- Mean = 2.04695
- Std.dev = 1.24068
- 635 items above graph maximum of 6.63423
|
