Data
458,244 items of data are available, covering 210,856 participants.
Defined-instances run from 0 to 4, labelled using Instancing
1.
Units of measurement are g.
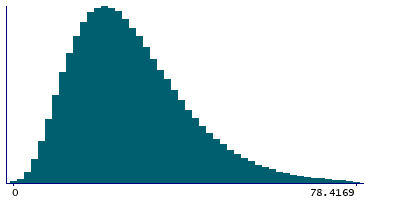
| Maximum | 213.972 |
| Decile 9 | 45.1413 |
| Decile 8 | 37.2384 |
| Decile 7 | 32.2195 |
| Decile 6 | 28.3214 |
| Median | 24.9503 |
| Decile 4 | 21.8673 |
| Decile 3 | 18.8378 |
| Decile 2 | 15.6662 |
| Decile 1 | 11.8657 |
| Minimum | 0 |
|
|
- Mean = 27.178
- Std.dev = 13.7889
- 2104 items above graph maximum of 78.4169
|
5 Instances
Instance 0 : Conducted in assessment centre, April 2009 to September 2010.
70,655 participants, 70,655 items
| Maximum | 194.834 |
| Decile 9 | 44.9013 |
| Decile 8 | 36.7462 |
| Decile 7 | 31.5688 |
| Decile 6 | 27.575 |
| Median | 24.2091 |
| Decile 4 | 21.1162 |
| Decile 3 | 18.0491 |
| Decile 2 | 14.8836 |
| Decile 1 | 11.0459 |
| Minimum | 0 |
|
|
- Mean = 26.5998
- Std.dev = 14.1832
- 380 items above graph maximum of 78.7566
|
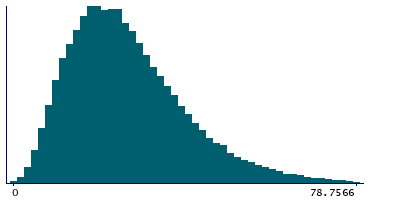
Instance 1 : On-line cycle 1, February 2011 to April 2011.
100,519 participants, 100,519 items
| Maximum | 177.851 |
| Decile 9 | 44.8451 |
| Decile 8 | 37.0964 |
| Decile 7 | 32.0934 |
| Decile 6 | 28.233 |
| Median | 24.9046 |
| Decile 4 | 21.852 |
| Decile 3 | 18.9064 |
| Decile 2 | 15.726 |
| Decile 1 | 12.0014 |
| Minimum | 0 |
|
|
- Mean = 27.0894
- Std.dev = 13.5712
- 454 items above graph maximum of 77.6888
|
Instance 2 : On-line cycle 2, June 2011 to September 2011.
83,201 participants, 83,201 items
| Maximum | 207.875 |
| Decile 9 | 45.318 |
| Decile 8 | 37.4802 |
| Decile 7 | 32.4401 |
| Decile 6 | 28.5188 |
| Median | 25.1645 |
| Decile 4 | 22.0249 |
| Decile 3 | 18.947 |
| Decile 2 | 15.7413 |
| Decile 1 | 11.9443 |
| Minimum | 0 |
|

|
- Mean = 27.3373
- Std.dev = 13.825
- 373 items above graph maximum of 78.6918
|
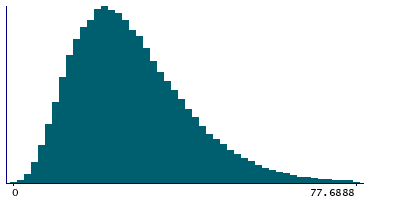
Instance 3 : On-line cycle 3, October 2011 to December 2011.
103,700 participants, 103,700 items
| Maximum | 171.151 |
| Decile 9 | 44.7925 |
| Decile 8 | 36.9866 |
| Decile 7 | 32.0282 |
| Decile 6 | 28.1892 |
| Median | 24.8719 |
| Decile 4 | 21.813 |
| Decile 3 | 18.8583 |
| Decile 2 | 15.7913 |
| Decile 1 | 12.0357 |
| Minimum | 0 |
|

|
- Mean = 27.0679
- Std.dev = 13.5271
- 470 items above graph maximum of 77.5494
|
Instance 4 : On-line cycle 4, April 2012 to June 2012.
100,169 participants, 100,169 items
| Maximum | 213.972 |
| Decile 9 | 45.7655 |
| Decile 8 | 37.7967 |
| Decile 7 | 32.7966 |
| Decile 6 | 28.8646 |
| Median | 25.4601 |
| Decile 4 | 22.3262 |
| Decile 3 | 19.2425 |
| Decile 2 | 16.0085 |
| Decile 1 | 12.1347 |
| Minimum | 0 |
|

|
- Mean = 27.6562
- Std.dev = 13.9429
- 438 items above graph maximum of 79.3964
|
