Data
458,244 items of data are available, covering 210,856 participants.
Defined-instances run from 0 to 4, labelled using Instancing
1.
Units of measurement are g.
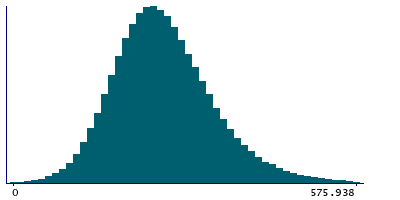
| Maximum | 2618.38 |
| Decile 9 | 364.022 |
| Decile 8 | 318.441 |
| Decile 7 | 289.011 |
| Decile 6 | 265.673 |
| Median | 245.186 |
| Decile 4 | 225.572 |
| Decile 3 | 205.487 |
| Decile 2 | 182.738 |
| Decile 1 | 152.107 |
| Minimum | 0 |
|
|
- Mean = 253.664
- Std.dev = 88.5281
- 1813 items above graph maximum of 575.938
|
5 Instances
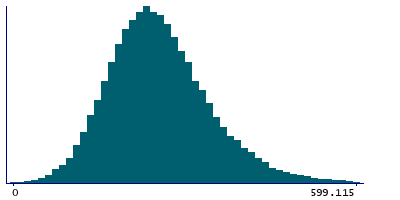
Instance 0 : Conducted in assessment centre, April 2009 to September 2010.
70,655 participants, 70,655 items
| Maximum | 2618.38 |
| Decile 9 | 374.488 |
| Decile 8 | 325.132 |
| Decile 7 | 293.798 |
| Decile 6 | 268.983 |
| Median | 247.356 |
| Decile 4 | 226.907 |
| Decile 3 | 205.494 |
| Decile 2 | 181.63 |
| Decile 1 | 149.862 |
| Minimum | 0 |
|
|
- Mean = 257.222
- Std.dev = 95.2707
- 357 items above graph maximum of 599.115
|
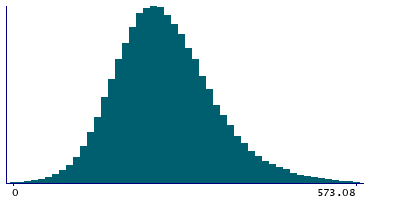
Instance 1 : On-line cycle 1, February 2011 to April 2011.
100,519 participants, 100,519 items
| Maximum | 1270.22 |
| Decile 9 | 363.932 |
| Decile 8 | 319.663 |
| Decile 7 | 290.77 |
| Decile 6 | 267.749 |
| Median | 247.218 |
| Decile 4 | 227.647 |
| Decile 3 | 207.66 |
| Decile 2 | 184.978 |
| Decile 1 | 154.784 |
| Minimum | 0 |
|
|
- Mean = 255.141
- Std.dev = 86.8989
- 372 items above graph maximum of 573.08
|
Instance 2 : On-line cycle 2, June 2011 to September 2011.
83,201 participants, 83,201 items
| Maximum | 1651.49 |
| Decile 9 | 362.43 |
| Decile 8 | 316.886 |
| Decile 7 | 287.324 |
| Decile 6 | 264.233 |
| Median | 243.832 |
| Decile 4 | 224.4 |
| Decile 3 | 204.58 |
| Decile 2 | 182.372 |
| Decile 1 | 151.702 |
| Minimum | 0 |
|

|
- Mean = 252.2
- Std.dev = 87.6684
- 306 items above graph maximum of 573.158
|
Instance 3 : On-line cycle 3, October 2011 to December 2011.
103,700 participants, 103,700 items
| Maximum | 1386.44 |
| Decile 9 | 360.612 |
| Decile 8 | 315.931 |
| Decile 7 | 286.64 |
| Decile 6 | 263.614 |
| Median | 243.614 |
| Decile 4 | 224.146 |
| Decile 3 | 204.218 |
| Decile 2 | 181.894 |
| Decile 1 | 151.477 |
| Minimum | 0 |
|

|
- Mean = 251.744
- Std.dev = 86.3942
- 352 items above graph maximum of 569.747
|
Instance 4 : On-line cycle 4, April 2012 to June 2012.
100,169 participants, 100,169 items
| Maximum | 1912.84 |
| Decile 9 | 361.92 |
| Decile 8 | 316.954 |
| Decile 7 | 287.886 |
| Decile 6 | 264.886 |
| Median | 244.622 |
| Decile 4 | 225.287 |
| Decile 3 | 205.393 |
| Decile 2 | 182.579 |
| Decile 1 | 152.042 |
| Minimum | 0 |
|

|
- Mean = 252.878
- Std.dev = 88.0044
- 420 items above graph maximum of 571.798
|
