Data
458,244 items of data are available, covering 210,856 participants.
Defined-instances run from 0 to 4, labelled using Instancing
1.
Units of measurement are g.
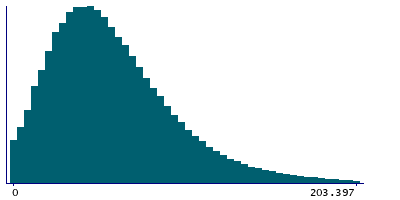
| Maximum | 944.101 |
| Decile 9 | 110.497 |
| Decile 8 | 87.348 |
| Decile 7 | 73.1548 |
| Decile 6 | 62.3337 |
| Median | 53.0774 |
| Decile 4 | 44.7376 |
| Decile 3 | 36.5151 |
| Decile 2 | 27.9385 |
| Decile 1 | 17.5973 |
| Minimum | 0 |
|
|
- Mean = 60.2958
- Std.dev = 40.0617
- 3443 items above graph maximum of 203.397
|
5 Instances
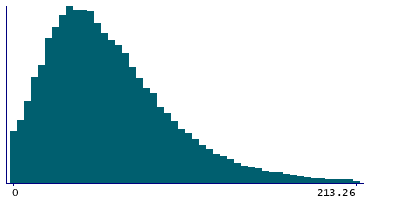
Instance 0 : Conducted in assessment centre, April 2009 to September 2010.
70,655 participants, 70,655 items
| Maximum | 913.628 |
| Decile 9 | 114.954 |
| Decile 8 | 89.8372 |
| Decile 7 | 74.6578 |
| Decile 6 | 63.203 |
| Median | 53.1938 |
| Decile 4 | 44.4186 |
| Decile 3 | 35.9063 |
| Decile 2 | 27.1596 |
| Decile 1 | 16.6482 |
| Minimum | 0 |
|
|
- Mean = 61.5087
- Std.dev = 43.0596
- 543 items above graph maximum of 213.26
|
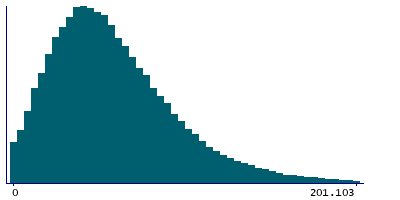
Instance 1 : On-line cycle 1, February 2011 to April 2011.
100,519 participants, 100,519 items
| Maximum | 476.225 |
| Decile 9 | 109.397 |
| Decile 8 | 86.9748 |
| Decile 7 | 72.8943 |
| Decile 6 | 62.0719 |
| Median | 52.9775 |
| Decile 4 | 44.698 |
| Decile 3 | 36.6351 |
| Decile 2 | 28.0258 |
| Decile 1 | 17.6918 |
| Minimum | 0 |
|
|
- Mean = 59.9691
- Std.dev = 39.2559
- 731 items above graph maximum of 201.103
|
Instance 2 : On-line cycle 2, June 2011 to September 2011.
83,201 participants, 83,201 items
| Maximum | 767.217 |
| Decile 9 | 112.187 |
| Decile 8 | 88.7401 |
| Decile 7 | 74.6028 |
| Decile 6 | 63.7714 |
| Median | 54.5007 |
| Decile 4 | 46.0756 |
| Decile 3 | 37.6407 |
| Decile 2 | 28.8899 |
| Decile 1 | 18.5353 |
| Minimum | 0 |
|

|
- Mean = 61.5595
- Std.dev = 40.1744
- 606 items above graph maximum of 205.838
|
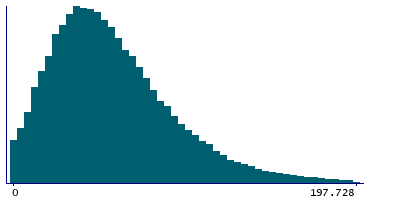
Instance 3 : On-line cycle 3, October 2011 to December 2011.
103,700 participants, 103,700 items
| Maximum | 586.324 |
| Decile 9 | 107.404 |
| Decile 8 | 84.9144 |
| Decile 7 | 71.1273 |
| Decile 6 | 60.5469 |
| Median | 51.6033 |
| Decile 4 | 43.4993 |
| Decile 3 | 35.6375 |
| Decile 2 | 27.2263 |
| Decile 1 | 17.0803 |
| Minimum | 0 |
|
|
- Mean = 58.6168
- Std.dev = 38.7568
- 784 items above graph maximum of 197.728
|
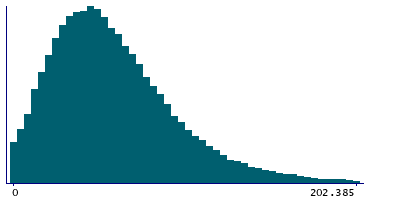
Instance 4 : On-line cycle 4, April 2012 to June 2012.
100,169 participants, 100,169 items
| Maximum | 944.101 |
| Decile 9 | 110.137 |
| Decile 8 | 87.2457 |
| Decile 7 | 73.3951 |
| Decile 6 | 62.63 |
| Median | 53.4138 |
| Decile 4 | 45.1891 |
| Decile 3 | 36.8994 |
| Decile 2 | 28.2995 |
| Decile 1 | 17.8901 |
| Minimum | 0 |
|
|
- Mean = 60.4568
- Std.dev = 39.8352
- 763 items above graph maximum of 202.385
|
