Data
458,244 items of data are available, covering 210,856 participants.
Defined-instances run from 0 to 4, labelled using Instancing
1.
Units of measurement are g.
| Maximum | 1219.51 |
| Decile 9 | 192.506 |
| Decile 8 | 163.228 |
| Decile 7 | 144.87 |
| Decile 6 | 130.486 |
| Median | 117.817 |
| Decile 4 | 105.914 |
| Decile 3 | 93.9528 |
| Decile 2 | 80.7478 |
| Decile 1 | 63.6874 |
| Minimum | 0 |
|
|
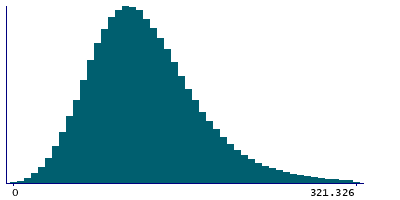
- Mean = 124.63
- Std.dev = 54.2489
- 2346 items above graph maximum of 321.326
|
5 Instances
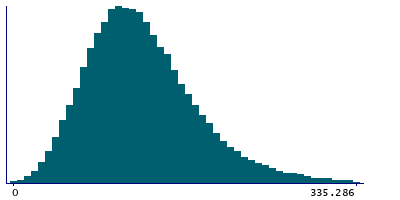
Instance 0 : Conducted in assessment centre, April 2009 to September 2010.
70,655 participants, 70,655 items
| Maximum | 1219.51 |
| Decile 9 | 198.966 |
| Decile 8 | 167.834 |
| Decile 7 | 148.243 |
| Decile 6 | 132.614 |
| Median | 119.467 |
| Decile 4 | 106.818 |
| Decile 3 | 94.2261 |
| Decile 2 | 80.3471 |
| Decile 1 | 62.6466 |
| Minimum | 0 |
|
|
- Mean = 127.163
- Std.dev = 58.7039
- 400 items above graph maximum of 335.286
|
Instance 1 : On-line cycle 1, February 2011 to April 2011.
100,519 participants, 100,519 items
| Maximum | 691.533 |
| Decile 9 | 192.594 |
| Decile 8 | 163.592 |
| Decile 7 | 145.583 |
| Decile 6 | 131.385 |
| Median | 118.653 |
| Decile 4 | 107.064 |
| Decile 3 | 94.8842 |
| Decile 2 | 81.5573 |
| Decile 1 | 64.6006 |
| Minimum | 0 |
|

|
- Mean = 125.198
- Std.dev = 53.3605
- 470 items above graph maximum of 320.587
|
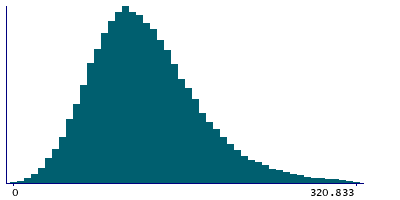
Instance 2 : On-line cycle 2, June 2011 to September 2011.
83,201 participants, 83,201 items
| Maximum | 1064.66 |
| Decile 9 | 192.715 |
| Decile 8 | 163.852 |
| Decile 7 | 145.288 |
| Decile 6 | 130.972 |
| Median | 118.27 |
| Decile 4 | 106.319 |
| Decile 3 | 94.635 |
| Decile 2 | 81.5849 |
| Decile 1 | 64.5975 |
| Minimum | 0 |
|
|
- Mean = 125.134
- Std.dev = 53.9265
- 449 items above graph maximum of 320.833
|
Instance 3 : On-line cycle 3, October 2011 to December 2011.
103,700 participants, 103,700 items
| Maximum | 807.22 |
| Decile 9 | 188.471 |
| Decile 8 | 160.155 |
| Decile 7 | 142.347 |
| Decile 6 | 128.35 |
| Median | 115.881 |
| Decile 4 | 104.027 |
| Decile 3 | 92.2126 |
| Decile 2 | 79.3643 |
| Decile 1 | 62.6125 |
| Minimum | 0 |
|

|
- Mean = 122.283
- Std.dev = 52.7091
- 515 items above graph maximum of 314.33
|
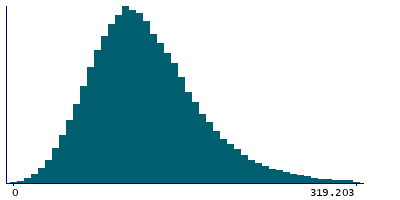
Instance 4 : On-line cycle 4, April 2012 to June 2012.
100,169 participants, 100,169 items
| Maximum | 1153.92 |
| Decile 9 | 191.566 |
| Decile 8 | 162.336 |
| Decile 7 | 144.393 |
| Decile 6 | 129.992 |
| Median | 117.561 |
| Decile 4 | 105.844 |
| Decile 3 | 94.1535 |
| Decile 2 | 81.0759 |
| Decile 1 | 63.9293 |
| Minimum | 0 |
|
|
- Mean = 124.282
- Std.dev = 53.5959
- 479 items above graph maximum of 319.203
|
