Data
458,244 items of data are available, covering 210,856 participants.
Defined-instances run from 0 to 4, labelled using Instancing
1.
Units of measurement are g.
| Maximum | 344.226 |
| Decile 9 | 56.1224 |
| Decile 8 | 45.1186 |
| Decile 7 | 38.3595 |
| Decile 6 | 33.1993 |
| Median | 28.8643 |
| Decile 4 | 24.8817 |
| Decile 3 | 21.0572 |
| Decile 2 | 17.0162 |
| Decile 1 | 12.154 |
| Minimum | 0 |
|
|
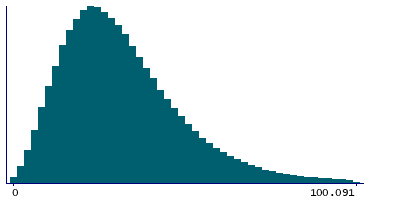
- Mean = 32.2526
- Std.dev = 18.8253
- 3257 items above graph maximum of 100.091
|
5 Instances
Instance 0 : Conducted in assessment centre, April 2009 to September 2010.
70,655 participants, 70,655 items
| Maximum | 328.282 |
| Decile 9 | 56.7578 |
| Decile 8 | 45.526 |
| Decile 7 | 38.4255 |
| Decile 6 | 33.0871 |
| Median | 28.6312 |
| Decile 4 | 24.518 |
| Decile 3 | 20.5905 |
| Decile 2 | 16.4551 |
| Decile 1 | 11.5245 |
| Minimum | 0 |
|

|
- Mean = 32.2001
- Std.dev = 19.4545
- 525 items above graph maximum of 101.991
|
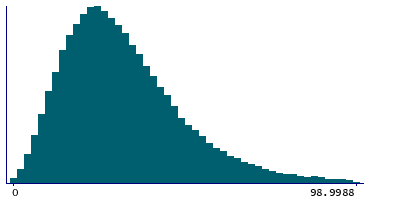
Instance 1 : On-line cycle 1, February 2011 to April 2011.
100,519 participants, 100,519 items
| Maximum | 309.001 |
| Decile 9 | 55.7322 |
| Decile 8 | 44.918 |
| Decile 7 | 38.342 |
| Decile 6 | 33.2624 |
| Median | 28.9696 |
| Decile 4 | 25.056 |
| Decile 3 | 21.2998 |
| Decile 2 | 17.2764 |
| Decile 1 | 12.4656 |
| Minimum | 0 |
|
|
- Mean = 32.2803
- Std.dev = 18.5298
- 706 items above graph maximum of 98.9988
|
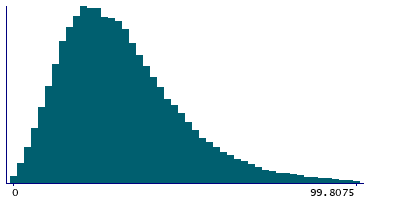
Instance 2 : On-line cycle 2, June 2011 to September 2011.
83,201 participants, 83,201 items
| Maximum | 273.931 |
| Decile 9 | 55.9338 |
| Decile 8 | 45.0933 |
| Decile 7 | 38.3369 |
| Decile 6 | 33.1608 |
| Median | 28.8888 |
| Decile 4 | 24.7811 |
| Decile 3 | 20.8905 |
| Decile 2 | 16.8846 |
| Decile 1 | 12.06 |
| Minimum | 0 |
|
|
- Mean = 32.1267
- Std.dev = 18.7269
- 553 items above graph maximum of 99.8075
|
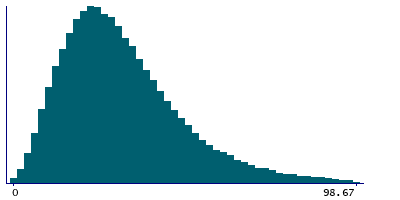
Instance 3 : On-line cycle 3, October 2011 to December 2011.
103,700 participants, 103,700 items
| Maximum | 245.267 |
| Decile 9 | 55.3957 |
| Decile 8 | 44.3521 |
| Decile 7 | 37.7045 |
| Decile 6 | 32.6785 |
| Median | 28.4354 |
| Decile 4 | 24.5319 |
| Decile 3 | 20.8341 |
| Decile 2 | 16.9112 |
| Decile 1 | 12.1215 |
| Minimum | 0 |
|
|
- Mean = 31.8229
- Std.dev = 18.4871
- 726 items above graph maximum of 98.67
|
Instance 4 : On-line cycle 4, April 2012 to June 2012.
100,169 participants, 100,169 items
| Maximum | 344.226 |
| Decile 9 | 56.9206 |
| Decile 8 | 45.8509 |
| Decile 7 | 38.9977 |
| Decile 6 | 33.8172 |
| Median | 29.3882 |
| Decile 4 | 25.4017 |
| Decile 3 | 21.532 |
| Decile 2 | 17.3757 |
| Decile 1 | 12.4064 |
| Minimum | 0 |
|

|
- Mean = 32.8114
- Std.dev = 19.081
- 716 items above graph maximum of 101.435
|
