Data
458,244 items of data are available, covering 210,856 participants.
Defined-instances run from 0 to 4, labelled using Instancing
1.
Units of measurement are g.
| Maximum | 674.44 |
| Decile 9 | 115.674 |
| Decile 8 | 97.3662 |
| Decile 7 | 85.7303 |
| Decile 6 | 76.6248 |
| Median | 68.7502 |
| Decile 4 | 61.3954 |
| Decile 3 | 54.1226 |
| Decile 2 | 46.2786 |
| Decile 1 | 36.4539 |
| Minimum | 0 |
|

|
- Mean = 73.41
- Std.dev = 32.9183
- 2065 items above graph maximum of 194.894
|
5 Instances
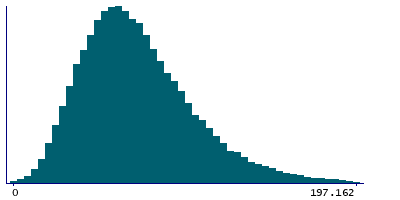
Instance 0 : Conducted in assessment centre, April 2009 to September 2010.
70,655 participants, 70,655 items
| Maximum | 584.228 |
| Decile 9 | 115.674 |
| Decile 8 | 96.611 |
| Decile 7 | 84.4234 |
| Decile 6 | 74.9981 |
| Median | 66.9737 |
| Decile 4 | 59.5418 |
| Decile 3 | 52.1799 |
| Decile 2 | 44.2044 |
| Decile 1 | 34.1869 |
| Minimum | 0 |
|
|
- Mean = 72.1043
- Std.dev = 34.1972
- 367 items above graph maximum of 197.162
|
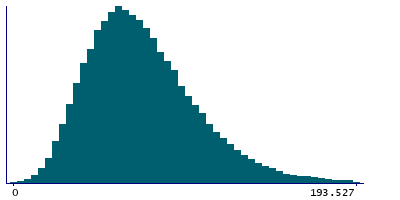
Instance 1 : On-line cycle 1, February 2011 to April 2011.
100,519 participants, 100,519 items
| Maximum | 470.934 |
| Decile 9 | 115.206 |
| Decile 8 | 97.3601 |
| Decile 7 | 85.8059 |
| Decile 6 | 76.7105 |
| Median | 68.8863 |
| Decile 4 | 61.5316 |
| Decile 3 | 54.4038 |
| Decile 2 | 46.6349 |
| Decile 1 | 36.8839 |
| Minimum | 0 |
|
|
- Mean = 73.4311
- Std.dev = 32.4193
- 417 items above graph maximum of 193.527
|
Instance 2 : On-line cycle 2, June 2011 to September 2011.
83,201 participants, 83,201 items
| Maximum | 674.44 |
| Decile 9 | 115.898 |
| Decile 8 | 97.5112 |
| Decile 7 | 85.9371 |
| Decile 6 | 76.8455 |
| Median | 69.013 |
| Decile 4 | 61.624 |
| Decile 3 | 54.3263 |
| Decile 2 | 46.4461 |
| Decile 1 | 36.6223 |
| Minimum | 0 |
|

|
- Mean = 73.6304
- Std.dev = 32.9234
- 362 items above graph maximum of 195.173
|
Instance 3 : On-line cycle 3, October 2011 to December 2011.
103,700 participants, 103,700 items
| Maximum | 456.628 |
| Decile 9 | 114.506 |
| Decile 8 | 96.4958 |
| Decile 7 | 85.081 |
| Decile 6 | 76.1681 |
| Median | 68.3591 |
| Decile 4 | 61.1416 |
| Decile 3 | 53.9818 |
| Decile 2 | 46.3031 |
| Decile 1 | 36.7716 |
| Minimum | 0 |
|

|
- Mean = 72.9252
- Std.dev = 32.1147
- 437 items above graph maximum of 192.241
|
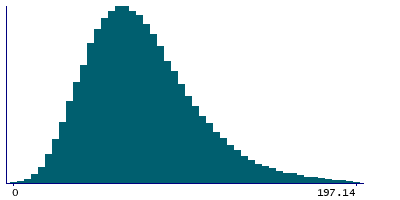
Instance 4 : On-line cycle 4, April 2012 to June 2012.
100,169 participants, 100,169 items
| Maximum | 610.28 |
| Decile 9 | 117.201 |
| Decile 8 | 98.6546 |
| Decile 7 | 86.9361 |
| Decile 6 | 77.8667 |
| Median | 70.0092 |
| Decile 4 | 62.6211 |
| Decile 3 | 55.2591 |
| Decile 2 | 47.2807 |
| Decile 1 | 37.262 |
| Minimum | 0 |
|
|
- Mean = 74.6287
- Std.dev = 33.266
- 478 items above graph maximum of 197.14
|
