Data
458,244 items of data are available, covering 210,856 participants.
Defined-instances run from 0 to 4, labelled using Instancing
1.
Units of measurement are g.
| Maximum | 573.196 |
| Decile 9 | 82.7765 |
| Decile 8 | 69.7017 |
| Decile 7 | 61.7147 |
| Decile 6 | 55.8001 |
| Median | 50.6466 |
| Decile 4 | 45.534 |
| Decile 3 | 39.6487 |
| Decile 2 | 32.1657 |
| Decile 1 | 22.7769 |
| Minimum | 0 |
|

|
- Mean = 52.4702
- Std.dev = 24.9717
- 2463 items above graph maximum of 142.776
|
5 Instances
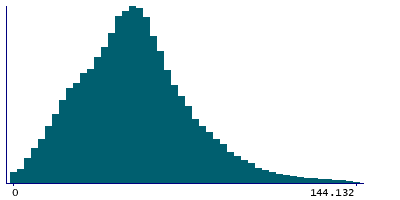
Instance 0 : Conducted in assessment centre, April 2009 to September 2010.
70,655 participants, 70,655 items
| Maximum | 546.95 |
| Decile 9 | 82.7206 |
| Decile 8 | 69.2337 |
| Decile 7 | 60.9432 |
| Decile 6 | 54.8857 |
| Median | 49.6534 |
| Decile 4 | 44.2748 |
| Decile 3 | 38.1703 |
| Decile 2 | 30.5313 |
| Decile 1 | 21.3092 |
| Minimum | 0 |
|
|
- Mean = 51.5729
- Std.dev = 25.6536
- 412 items above graph maximum of 144.132
|
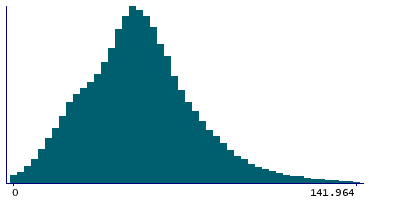
Instance 1 : On-line cycle 1, February 2011 to April 2011.
100,519 participants, 100,519 items
| Maximum | 466.381 |
| Decile 9 | 82.6446 |
| Decile 8 | 69.9228 |
| Decile 7 | 62.0977 |
| Decile 6 | 56.2286 |
| Median | 51.0928 |
| Decile 4 | 46.0594 |
| Decile 3 | 40.2841 |
| Decile 2 | 32.7255 |
| Decile 1 | 23.325 |
| Minimum | 0 |
|
|
- Mean = 52.8018
- Std.dev = 24.6846
- 526 items above graph maximum of 141.964
|
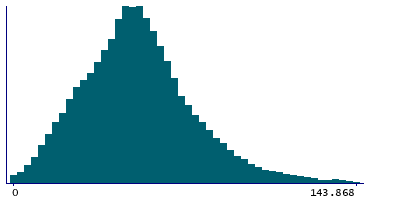
Instance 2 : On-line cycle 2, June 2011 to September 2011.
83,201 participants, 83,201 items
| Maximum | 573.196 |
| Decile 9 | 83.4759 |
| Decile 8 | 70.0696 |
| Decile 7 | 62.0248 |
| Decile 6 | 55.949 |
| Median | 50.722 |
| Decile 4 | 45.5843 |
| Decile 3 | 39.6803 |
| Decile 2 | 32.3375 |
| Decile 1 | 23.0839 |
| Minimum | 0 |
|
|
- Mean = 52.8221
- Std.dev = 25.3968
- 485 items above graph maximum of 143.868
|
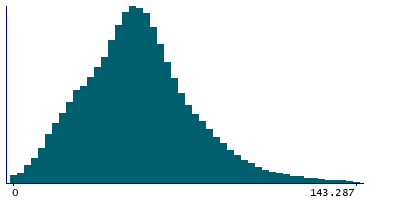
Instance 3 : On-line cycle 3, October 2011 to December 2011.
103,700 participants, 103,700 items
| Maximum | 429.519 |
| Decile 9 | 81.8454 |
| Decile 8 | 69.1175 |
| Decile 7 | 61.2875 |
| Decile 6 | 55.507 |
| Median | 50.4834 |
| Decile 4 | 45.4678 |
| Decile 3 | 39.6776 |
| Decile 2 | 32.1927 |
| Decile 1 | 22.6525 |
| Minimum | 0 |
|

|
- Mean = 52.0914
- Std.dev = 24.3937
- 519 items above graph maximum of 141.038
|
Instance 4 : On-line cycle 4, April 2012 to June 2012.
100,169 participants, 100,169 items
| Maximum | 449.481 |
| Decile 9 | 83.2266 |
| Decile 8 | 70.1155 |
| Decile 7 | 62.0444 |
| Decile 6 | 56.181 |
| Median | 51.0236 |
| Decile 4 | 45.8834 |
| Decile 3 | 40.0643 |
| Decile 2 | 32.5915 |
| Decile 1 | 23.1571 |
| Minimum | 0 |
|
|
- Mean = 52.8704
- Std.dev = 24.9841
- 529 items above graph maximum of 143.296
|
