Data
458,244 items of data are available, covering 210,856 participants.
Defined-instances run from 0 to 4, labelled using Instancing
1.
Units of measurement are g.
| Maximum | 297.45 |
| Decile 9 | 42.6285 |
| Decile 8 | 36.131 |
| Decile 7 | 32.2507 |
| Decile 6 | 29.2318 |
| Median | 26.6607 |
| Decile 4 | 24.2786 |
| Decile 3 | 21.8516 |
| Decile 2 | 19.114 |
| Decile 1 | 15.4604 |
| Minimum | 0 |
|
|
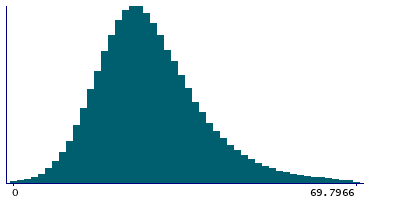
- Mean = 28.2622
- Std.dev = 11.7677
- 3308 items above graph maximum of 69.7966
|
5 Instances
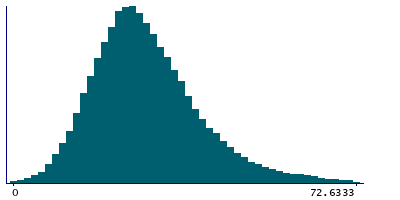
Instance 0 : Conducted in assessment centre, April 2009 to September 2010.
70,655 participants, 70,655 items
| Maximum | 297.45 |
| Decile 9 | 43.8375 |
| Decile 8 | 36.8789 |
| Decile 7 | 32.7909 |
| Decile 6 | 29.5609 |
| Median | 26.7886 |
| Decile 4 | 24.2924 |
| Decile 3 | 21.7729 |
| Decile 2 | 18.8828 |
| Decile 1 | 15.0417 |
| Minimum | 0 |
|
|
- Mean = 28.6056
- Std.dev = 12.5714
- 537 items above graph maximum of 72.6333
|
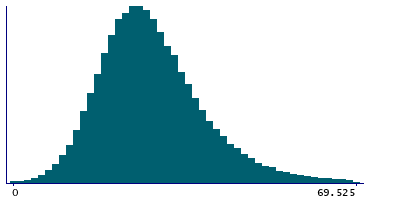
Instance 1 : On-line cycle 1, February 2011 to April 2011.
100,519 participants, 100,519 items
| Maximum | 171.126 |
| Decile 9 | 42.6501 |
| Decile 8 | 36.2383 |
| Decile 7 | 32.3991 |
| Decile 6 | 29.4084 |
| Median | 26.8668 |
| Decile 4 | 24.4799 |
| Decile 3 | 22.0352 |
| Decile 2 | 19.3747 |
| Decile 1 | 15.7752 |
| Minimum | 0 |
|
|
- Mean = 28.4151
- Std.dev = 11.5753
- 671 items above graph maximum of 69.525
|
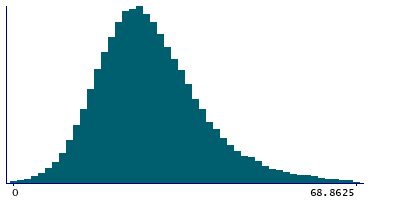
Instance 2 : On-line cycle 2, June 2011 to September 2011.
83,201 participants, 83,201 items
| Maximum | 190.234 |
| Decile 9 | 42.0743 |
| Decile 8 | 35.7564 |
| Decile 7 | 31.9724 |
| Decile 6 | 29.0075 |
| Median | 26.4308 |
| Decile 4 | 24.0496 |
| Decile 3 | 21.6266 |
| Decile 2 | 18.8745 |
| Decile 1 | 15.2861 |
| Minimum | 0 |
|
|
- Mean = 27.957
- Std.dev = 11.6157
- 604 items above graph maximum of 68.8625
|
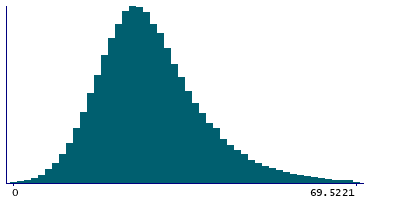
Instance 3 : On-line cycle 3, October 2011 to December 2011.
103,700 participants, 103,700 items
| Maximum | 191.624 |
| Decile 9 | 42.561 |
| Decile 8 | 36.1335 |
| Decile 7 | 32.1924 |
| Decile 6 | 29.2488 |
| Median | 26.699 |
| Decile 4 | 24.3254 |
| Decile 3 | 21.9645 |
| Decile 2 | 19.2559 |
| Decile 1 | 15.5999 |
| Minimum | 0 |
|
|
- Mean = 28.2908
- Std.dev = 11.597
- 716 items above graph maximum of 69.5221
|
Instance 4 : On-line cycle 4, April 2012 to June 2012.
100,169 participants, 100,169 items
| Maximum | 277.967 |
| Decile 9 | 42.238 |
| Decile 8 | 35.8393 |
| Decile 7 | 32.0162 |
| Decile 6 | 29.0227 |
| Median | 26.5175 |
| Decile 4 | 24.1914 |
| Decile 3 | 21.7778 |
| Decile 2 | 19.0448 |
| Decile 1 | 15.4263 |
| Minimum | 0 |
|

|
- Mean = 28.0903
- Std.dev = 11.6644
- 751 items above graph maximum of 69.0497
|
