Data
458,244 items of data are available, covering 210,856 participants.
Defined-instances run from 0 to 4, labelled using Instancing
1.
Units of measurement are g.
| Maximum | 795.952 |
| Decile 9 | 115.196 |
| Decile 8 | 100.46 |
| Decile 7 | 91.3443 |
| Decile 6 | 84.2593 |
| Median | 78.0079 |
| Decile 4 | 72.0042 |
| Decile 3 | 65.714 |
| Decile 2 | 58.3536 |
| Decile 1 | 48.4321 |
| Minimum | 0 |
|

|
- Mean = 80.7324
- Std.dev = 28.3539
- 2551 items above graph maximum of 181.96
|
5 Instances
Instance 0 : Conducted in assessment centre, April 2009 to September 2010.
70,655 participants, 70,655 items
| Maximum | 795.952 |
| Decile 9 | 116.172 |
| Decile 8 | 100.803 |
| Decile 7 | 91.2689 |
| Decile 6 | 83.8141 |
| Median | 77.2373 |
| Decile 4 | 70.8976 |
| Decile 3 | 64.4416 |
| Decile 2 | 56.7277 |
| Decile 1 | 46.3465 |
| Minimum | 0 |
|

|
- Mean = 80.1785
- Std.dev = 29.9137
- 432 items above graph maximum of 185.997
|
Instance 1 : On-line cycle 1, February 2011 to April 2011.
100,519 participants, 100,519 items
| Maximum | 611.899 |
| Decile 9 | 115.087 |
| Decile 8 | 100.647 |
| Decile 7 | 91.7976 |
| Decile 6 | 84.7938 |
| Median | 78.6312 |
| Decile 4 | 72.7582 |
| Decile 3 | 66.4012 |
| Decile 2 | 59.1455 |
| Decile 1 | 49.2469 |
| Minimum | 0 |
|
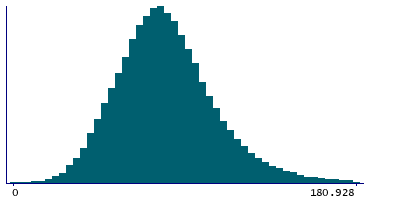
|
- Mean = 81.2169
- Std.dev = 27.8992
- 522 items above graph maximum of 180.928
|
Instance 2 : On-line cycle 2, June 2011 to September 2011.
83,201 participants, 83,201 items
| Maximum | 763.429 |
| Decile 9 | 115.51 |
| Decile 8 | 100.397 |
| Decile 7 | 91.2499 |
| Decile 6 | 84.1719 |
| Median | 77.9158 |
| Decile 4 | 71.8502 |
| Decile 3 | 65.5882 |
| Decile 2 | 58.3275 |
| Decile 1 | 48.4674 |
| Minimum | 0 |
|

|
- Mean = 80.7791
- Std.dev = 28.635
- 499 items above graph maximum of 182.553
|
Instance 3 : On-line cycle 3, October 2011 to December 2011.
103,700 participants, 103,700 items
| Maximum | 563.182 |
| Decile 9 | 114.232 |
| Decile 8 | 99.7893 |
| Decile 7 | 90.9382 |
| Decile 6 | 83.9202 |
| Median | 77.8281 |
| Decile 4 | 71.9477 |
| Decile 3 | 65.7782 |
| Decile 2 | 58.4906 |
| Decile 1 | 48.6941 |
| Minimum | 0 |
|

|
- Mean = 80.3822
- Std.dev = 27.5215
- 539 items above graph maximum of 179.77
|
Instance 4 : On-line cycle 4, April 2012 to June 2012.
100,169 participants, 100,169 items
| Maximum | 658.464 |
| Decile 9 | 115.33 |
| Decile 8 | 100.757 |
| Decile 7 | 91.4034 |
| Decile 6 | 84.4145 |
| Median | 78.1616 |
| Decile 4 | 72.2343 |
| Decile 3 | 65.9831 |
| Decile 2 | 58.5691 |
| Decile 1 | 48.8132 |
| Minimum | 0 |
|

|
- Mean = 80.9607
- Std.dev = 28.2793
- 564 items above graph maximum of 181.847
|
