Data
458,244 items of data are available, covering 210,856 participants.
Defined-instances run from 0 to 4, labelled using Instancing
1.
Units of measurement are kj/g.
| Maximum | 24.91 |
| Decile 9 | 8.87572 |
| Decile 8 | 7.84566 |
| Decile 7 | 7.19205 |
| Decile 6 | 6.67708 |
| Median | 6.22653 |
| Decile 4 | 5.80373 |
| Decile 3 | 5.38451 |
| Decile 2 | 4.92217 |
| Decile 1 | 4.32784 |
| Minimum | -1 |
|
|
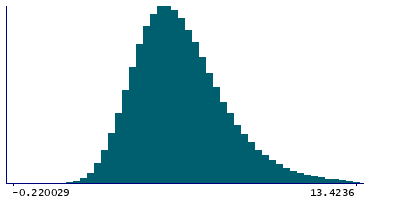
- Mean = 6.4621
- Std.dev = 1.87243
- 140 items below graph minimum of -0.220029
- 1708 items above graph maximum of 13.4236
|
5 Instances
Instance 0 : Conducted in assessment centre, April 2009 to September 2010.
70,655 participants, 70,655 items
| Maximum | 24.91 |
| Decile 9 | 9.04742 |
| Decile 8 | 7.94062 |
| Decile 7 | 7.2397 |
| Decile 6 | 6.70381 |
| Median | 6.22303 |
| Decile 4 | 5.77951 |
| Decile 3 | 5.34063 |
| Decile 2 | 4.86773 |
| Decile 1 | 4.26545 |
| Minimum | -1 |
|

|
- Mean = 6.49262
- Std.dev = 1.98328
- 36 items below graph minimum of -0.516511
- 280 items above graph maximum of 13.8294
|
Instance 1 : On-line cycle 1, February 2011 to April 2011.
100,519 participants, 100,519 items
| Maximum | 24.1095 |
| Decile 9 | 8.79498 |
| Decile 8 | 7.79504 |
| Decile 7 | 7.15019 |
| Decile 6 | 6.64434 |
| Median | 6.19543 |
| Decile 4 | 5.77491 |
| Decile 3 | 5.35735 |
| Decile 2 | 4.89589 |
| Decile 1 | 4.30637 |
| Minimum | -1 |
|

|
- Mean = 6.42188
- Std.dev = 1.84374
- 28 items below graph minimum of -0.182238
- 369 items above graph maximum of 13.2836
|
Instance 2 : On-line cycle 2, June 2011 to September 2011.
83,201 participants, 83,201 items
| Maximum | 22.304 |
| Decile 9 | 8.86569 |
| Decile 8 | 7.84543 |
| Decile 7 | 7.19546 |
| Decile 6 | 6.68237 |
| Median | 6.22583 |
| Decile 4 | 5.79495 |
| Decile 3 | 5.37093 |
| Decile 2 | 4.90995 |
| Decile 1 | 4.31206 |
| Minimum | -1 |
|

|
- Mean = 6.45574
- Std.dev = 1.87223
- 19 items below graph minimum of -0.241574
- 301 items above graph maximum of 13.4193
|
Instance 3 : On-line cycle 3, October 2011 to December 2011.
103,700 participants, 103,700 items
| Maximum | 23.9982 |
| Decile 9 | 8.82056 |
| Decile 8 | 7.79547 |
| Decile 7 | 7.14439 |
| Decile 6 | 6.64381 |
| Median | 6.21049 |
| Decile 4 | 5.7997 |
| Decile 3 | 5.39127 |
| Decile 2 | 4.93295 |
| Decile 1 | 4.34677 |
| Minimum | -1 |
|

|
- Mean = 6.44369
- Std.dev = 1.84552
- 22 items below graph minimum of -0.12702
- 408 items above graph maximum of 13.2944
|
Instance 4 : On-line cycle 4, April 2012 to June 2012.
100,169 participants, 100,169 items
| Maximum | 22.1541 |
| Decile 9 | 8.8872 |
| Decile 8 | 7.8847 |
| Decile 7 | 7.24133 |
| Decile 6 | 6.72888 |
| Median | 6.27599 |
| Decile 4 | 5.86157 |
| Decile 3 | 5.44145 |
| Decile 2 | 4.98303 |
| Decile 1 | 4.39113 |
| Minimum | -1 |
|

|
- Mean = 6.50527
- Std.dev = 1.84695
- 35 items below graph minimum of -0.104938
- 350 items above graph maximum of 13.3833
|
