Data
48,842 items of data are available, covering 44,313 participants.
Defined-instances run from 2 to 3, labelled using Instancing
2.
Units of measurement are AU.
| Maximum | 0.516678 |
| Decile 9 | 0.23582 |
| Decile 8 | 0.230506 |
| Decile 7 | 0.226812 |
| Decile 6 | 0.223771 |
| Median | 0.220971 |
| Decile 4 | 0.218258 |
| Decile 3 | 0.2154 |
| Decile 2 | 0.21208 |
| Decile 1 | 0.20775 |
| Minimum | 0 |
|

|
- Mean = 0.221481
- Std.dev = 0.011582
- 4 items below graph minimum of 0.17968
- 65 items above graph maximum of 0.26389
|
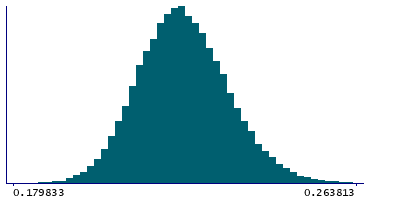
2 Instances
Instance 2 : Imaging visit (2014+)
44,081 participants, 44,081 items
| Maximum | 0.510416 |
| Decile 9 | 0.235949 |
| Decile 8 | 0.230544 |
| Decile 7 | 0.226854 |
| Decile 6 | 0.223782 |
| Median | 0.220969 |
| Decile 4 | 0.218249 |
| Decile 3 | 0.215388 |
| Decile 2 | 0.212055 |
| Decile 1 | 0.207725 |
| Minimum | 0 |
|
|
- Mean = 0.221497
- Std.dev = 0.0115934
- 4 items below graph minimum of 0.179501
- 57 items above graph maximum of 0.264173
|
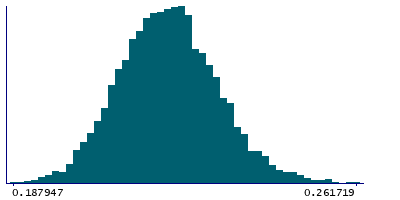
Instance 3 : First repeat imaging visit (2019+)
4,761 participants, 4,761 items
| Maximum | 0.516678 |
| Decile 9 | 0.234853 |
| Decile 8 | 0.230014 |
| Decile 7 | 0.226419 |
| Decile 6 | 0.223635 |
| Median | 0.220995 |
| Decile 4 | 0.218372 |
| Decile 3 | 0.215538 |
| Decile 2 | 0.212288 |
| Decile 1 | 0.208005 |
| Minimum | 0.187947 |
|
|
- Mean = 0.221331
- Std.dev = 0.0114745
- 5 items above graph maximum of 0.261701
|
Notes
Weighted-mean OD (orientation dispersion index) in tract left superior longitudinal fasciculus (from dMRI data)
0 Related Data-Fields
There are no related data-fields
0 Resources
There are no matching Resources
