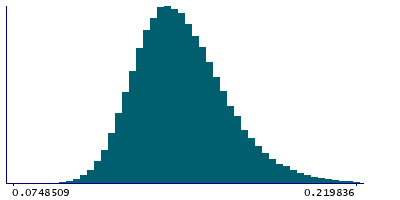
Data
48,842 items of data are available, covering 44,313 participants.
Defined-instances run from 2 to 3, labelled using Instancing
2.
Units of measurement are AU.
| Maximum | 0.287058 |
| Decile 9 | 0.170773 |
| Decile 8 | 0.160597 |
| Decile 7 | 0.153826 |
| Decile 6 | 0.148303 |
| Median | 0.143501 |
| Decile 4 | 0.138904 |
| Decile 3 | 0.134322 |
| Decile 2 | 0.12929 |
| Decile 1 | 0.122738 |
| Minimum | 0 |
|
|
- Mean = 0.145452
- Std.dev = 0.0195896
- 24 items below graph minimum of 0.0747028
- 100 items above graph maximum of 0.218809
|
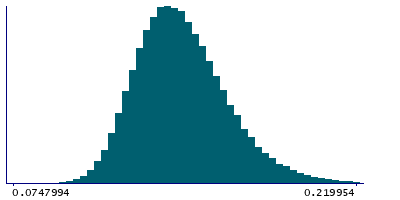
2 Instances
Instance 2 : Imaging visit (2014+)
44,081 participants, 44,081 items
| Maximum | 0.287058 |
| Decile 9 | 0.170751 |
| Decile 8 | 0.160643 |
| Decile 7 | 0.15387 |
| Decile 6 | 0.14836 |
| Median | 0.143589 |
| Decile 4 | 0.138936 |
| Decile 3 | 0.134321 |
| Decile 2 | 0.129257 |
| Decile 1 | 0.122703 |
| Minimum | 0 |
|
|
- Mean = 0.145484
- Std.dev = 0.0196266
- 21 items below graph minimum of 0.0746551
- 93 items above graph maximum of 0.218799
|
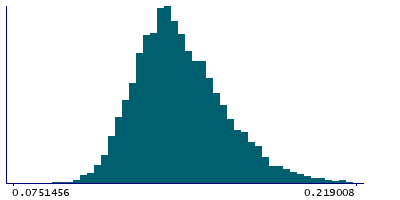
Instance 3 : First repeat imaging visit (2019+)
4,761 participants, 4,761 items
| Maximum | 0.231731 |
| Decile 9 | 0.171037 |
| Decile 8 | 0.160152 |
| Decile 7 | 0.153512 |
| Decile 6 | 0.147633 |
| Median | 0.142844 |
| Decile 4 | 0.138598 |
| Decile 3 | 0.134363 |
| Decile 2 | 0.129465 |
| Decile 1 | 0.123109 |
| Minimum | 0 |
|
|
- Mean = 0.145157
- Std.dev = 0.0192409
- 3 items below graph minimum of 0.0751804
- 7 items above graph maximum of 0.218966
|
Notes
Weighted-mean OD (orientation dispersion index) in tract right cingulate gyrus part of cingulum (from dMRI data)
0 Related Data-Fields
There are no related data-fields
0 Resources
There are no matching Resources
