Data
48,844 items of data are available, covering 44,315 participants.
Defined-instances run from 2 to 3, labelled using Instancing
2.
Units of measurement are AU.
| Maximum | 0.634588 |
| Decile 9 | 0.467931 |
| Decile 8 | 0.443286 |
| Decile 7 | 0.425322 |
| Decile 6 | 0.409209 |
| Median | 0.39411 |
| Decile 4 | 0.37863 |
| Decile 3 | 0.361693 |
| Decile 2 | 0.342446 |
| Decile 1 | 0.314775 |
| Minimum | -0.05313 |
|
|
- Mean = 0.39242
- Std.dev = 0.0597309
- 11 items below graph minimum of 0.161619
- 1 item above graph maximum of 0.621087
|
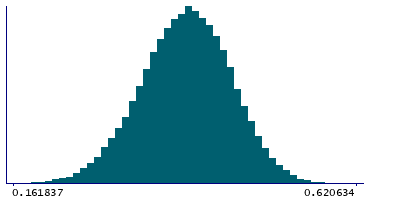
2 Instances
Instance 2 : Imaging visit (2014+)
44,083 participants, 44,083 items
| Maximum | 0.634588 |
| Decile 9 | 0.468044 |
| Decile 8 | 0.443624 |
| Decile 7 | 0.425665 |
| Decile 6 | 0.409606 |
| Median | 0.394589 |
| Decile 4 | 0.378976 |
| Decile 3 | 0.362196 |
| Decile 2 | 0.34281 |
| Decile 1 | 0.315199 |
| Minimum | -0.00643977 |
|

|
- Mean = 0.392767
- Std.dev = 0.0597292
- 10 items below graph minimum of 0.162355
- 1 item above graph maximum of 0.620889
|
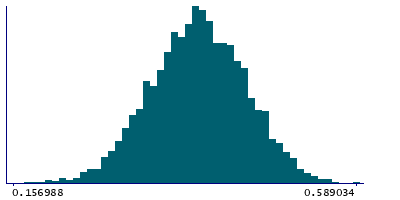
Instance 3 : First repeat imaging visit (2019+)
4,761 participants, 4,761 items
| Maximum | 0.589034 |
| Decile 9 | 0.466235 |
| Decile 8 | 0.440638 |
| Decile 7 | 0.42189 |
| Decile 6 | 0.404242 |
| Median | 0.389944 |
| Decile 4 | 0.375191 |
| Decile 3 | 0.358481 |
| Decile 2 | 0.339293 |
| Decile 1 | 0.311736 |
| Minimum | -0.05313 |
|
|
- Mean = 0.389201
- Std.dev = 0.0596502
- 1 item below graph minimum of 0.157237
|
Notes
Weighted-mean MO (diffusion tensor mode) in tract left superior thalamic radiation (from dMRI data)
0 Related Data-Fields
There are no related data-fields
0 Resources
There are no matching Resources
