Data
48,844 items of data are available, covering 44,315 participants.
Defined-instances run from 2 to 3, labelled using Instancing
2.
Units of measurement are AU.
| Maximum | 0.0012088 |
| Decile 9 | 0.000837885 |
| Decile 8 | 0.000819638 |
| Decile 7 | 0.000807485 |
| Decile 6 | 0.000797806 |
| Median | 0.000788886 |
| Decile 4 | 0.000780148 |
| Decile 3 | 0.000770969 |
| Decile 2 | 0.000760756 |
| Decile 1 | 0.000746517 |
| Minimum | 0 |
|

|
- Mean = 0.000790656
- Std.dev = 4.10152e-05
- 27 items below graph minimum of 0.000655149
- 106 items above graph maximum of 0.000929253
|
2 Instances
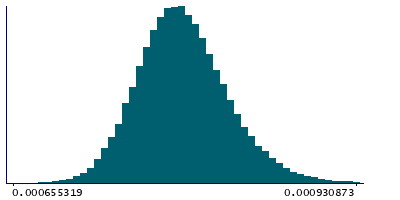
Instance 2 : Imaging visit (2014+)
44,083 participants, 44,083 items
| Maximum | 0.0012088 |
| Decile 9 | 0.000838442 |
| Decile 8 | 0.000820247 |
| Decile 7 | 0.000807906 |
| Decile 6 | 0.000798212 |
| Median | 0.000789238 |
| Decile 4 | 0.000780473 |
| Decile 3 | 0.000771345 |
| Decile 2 | 0.000761067 |
| Decile 1 | 0.000746705 |
| Minimum | 0 |
|
|
- Mean = 0.000791095
- Std.dev = 4.11001e-05
- 24 items below graph minimum of 0.000654967
- 100 items above graph maximum of 0.00093018
|
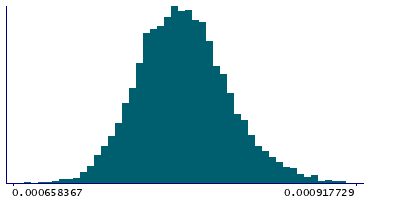
Instance 3 : First repeat imaging visit (2019+)
4,761 participants, 4,761 items
| Maximum | 0.00108115 |
| Decile 9 | 0.000831252 |
| Decile 8 | 0.000814729 |
| Decile 7 | 0.000803063 |
| Decile 6 | 0.000794053 |
| Median | 0.000785296 |
| Decile 4 | 0.000776883 |
| Decile 3 | 0.0007678 |
| Decile 2 | 0.000758169 |
| Decile 1 | 0.000744835 |
| Minimum | 0 |
|
|
- Mean = 0.00078659
- Std.dev = 3.99923e-05
- 3 items below graph minimum of 0.000658418
- 8 items above graph maximum of 0.000917668
|
Notes
Weighted-mean MD (mean diffusivity) in tract right acoustic radiation (from dMRI data)
0 Related Data-Fields
There are no related data-fields
0 Resources
There are no matching Resources
