Data
48,846 items of data are available, covering 44,317 participants.
Defined-instances run from 2 to 3, labelled using Instancing
2.
Units of measurement are AU.
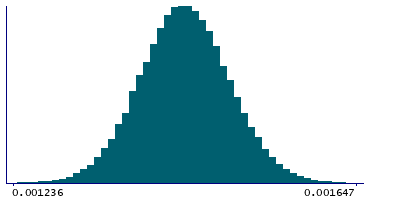
| Maximum | 0.001681 |
| Decile 9 | 0.001512 |
| Decile 8 | 0.001488 |
| Decile 7 | 0.00147 |
| Decile 6 | 0.001456 |
| Median | 0.001442 |
| Decile 4 | 0.001429 |
| Decile 3 | 0.001415 |
| Decile 2 | 0.001397 |
| Decile 1 | 0.001374 |
| Minimum | 0 |
|
|
- Mean = 0.00144223
- Std.dev = 5.76633e-05
- 46 items below graph minimum of 0.001236
- 10 items above graph maximum of 0.00165
|
2 Instances
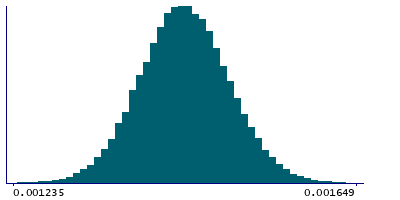
Instance 2 : Imaging visit (2014+)
44,085 participants, 44,085 items
| Maximum | 0.001681 |
| Decile 9 | 0.001513 |
| Decile 8 | 0.001488 |
| Decile 7 | 0.001471 |
| Decile 6 | 0.001456 |
| Median | 0.001443 |
| Decile 4 | 0.001429 |
| Decile 3 | 0.001415 |
| Decile 2 | 0.001397 |
| Decile 1 | 0.001374 |
| Minimum | 0 |
|
|
- Mean = 0.00144258
- Std.dev = 5.81182e-05
- 42 items below graph minimum of 0.001235
- 10 items above graph maximum of 0.001652
|
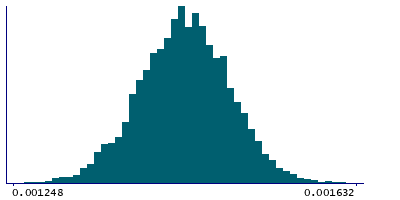
Instance 3 : First repeat imaging visit (2019+)
4,761 participants, 4,761 items
| Maximum | 0.001648 |
| Decile 9 | 0.001504 |
| Decile 8 | 0.0014815 |
| Decile 7 | 0.001465 |
| Decile 6 | 0.0014525 |
| Median | 0.00144 |
| Decile 4 | 0.001428 |
| Decile 3 | 0.001414 |
| Decile 2 | 0.001397 |
| Decile 1 | 0.001376 |
| Minimum | 0.000632 |
|
|
- Mean = 0.00143896
- Std.dev = 5.31548e-05
- 5 items below graph minimum of 0.001248
- 1 item above graph maximum of 0.001632
|
Notes
Mean L1 in cerebral peduncle (right) on FA (fractional anisotropy) skeleton (from dMRI data)
0 Related Data-Fields
There are no related data-fields
0 Resources
There are no matching Resources
