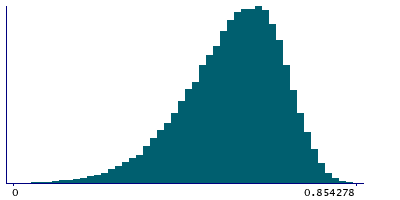
Data
48,846 items of data are available, covering 44,317 participants.
Defined-instances run from 2 to 3, labelled using Instancing
2.
Units of measurement are AU.
| Maximum | 0.850738 |
| Decile 9 | 0.686779 |
| Decile 8 | 0.64856 |
| Decile 7 | 0.617937 |
| Decile 6 | 0.588809 |
| Median | 0.559361 |
| Decile 4 | 0.527223 |
| Decile 3 | 0.490878 |
| Decile 2 | 0.445364 |
| Decile 1 | 0.378667 |
| Minimum | -0.188607 |
|
|
- Mean = 0.54376
- Std.dev = 0.121873
- 14 items below graph minimum of 0
|
2 Instances
Instance 2 : Imaging visit (2014+)
44,085 participants, 44,085 items
| Maximum | 0.846735 |
| Decile 9 | 0.686327 |
| Decile 8 | 0.648313 |
| Decile 7 | 0.617698 |
| Decile 6 | 0.588756 |
| Median | 0.559352 |
| Decile 4 | 0.5273 |
| Decile 3 | 0.491138 |
| Decile 2 | 0.445504 |
| Decile 1 | 0.379267 |
| Minimum | -0.188607 |
|

|
- Mean = 0.54374
- Std.dev = 0.12162
- 13 items below graph minimum of 0
|
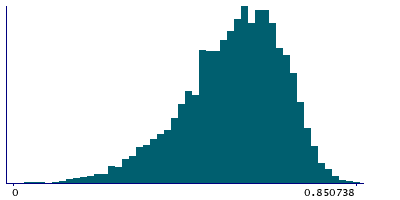
Instance 3 : First repeat imaging visit (2019+)
4,761 participants, 4,761 items
| Maximum | 0.850738 |
| Decile 9 | 0.690873 |
| Decile 8 | 0.651513 |
| Decile 7 | 0.620738 |
| Decile 6 | 0.589211 |
| Median | 0.55941 |
| Decile 4 | 0.526168 |
| Decile 3 | 0.487965 |
| Decile 2 | 0.444723 |
| Decile 1 | 0.372769 |
| Minimum | -0.023866 |
|
|
- Mean = 0.543949
- Std.dev = 0.124195
- 1 item below graph minimum of 0
|
Notes
Mean MO (diffusion tensor mode) in corticospinal tract (left) on FA (fractional anisotropy) skeleton (from dMRI data)
0 Related Data-Fields
There are no related data-fields
0 Resources
There are no matching Resources
