Data
48,846 items of data are available, covering 44,317 participants.
Defined-instances run from 2 to 3, labelled using Instancing
2.
Units of measurement are AU.
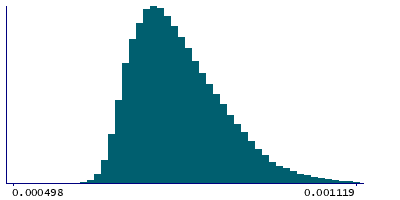
| Maximum | 0.001711 |
| Decile 9 | 0.00091 |
| Decile 8 | 0.000864 |
| Decile 7 | 0.000832 |
| Decile 6 | 0.000807 |
| Median | 0.000785 |
| Decile 4 | 0.000765 |
| Decile 3 | 0.000747 |
| Decile 2 | 0.000728 |
| Decile 1 | 0.000705 |
| Minimum | 0 |
|
|
- Mean = 0.000798888
- Std.dev = 8.41715e-05
- 3 items below graph minimum of 0.0005
- 195 items above graph maximum of 0.001115
|
2 Instances
Instance 2 : Imaging visit (2014+)
44,085 participants, 44,085 items
| Maximum | 0.001711 |
| Decile 9 | 0.000911 |
| Decile 8 | 0.000864 |
| Decile 7 | 0.000832 |
| Decile 6 | 0.000806 |
| Median | 0.000785 |
| Decile 4 | 0.000765 |
| Decile 3 | 0.000747 |
| Decile 2 | 0.000728 |
| Decile 1 | 0.000706 |
| Minimum | 0 |
|

|
- Mean = 0.000798902
- Std.dev = 8.42159e-05
- 3 items below graph minimum of 0.000501
- 181 items above graph maximum of 0.001116
|
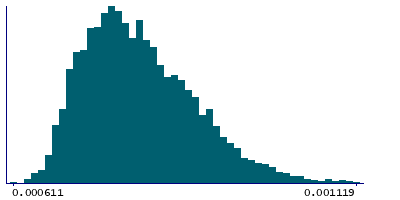
Instance 3 : First repeat imaging visit (2019+)
4,761 participants, 4,761 items
| Maximum | 0.001263 |
| Decile 9 | 0.0009095 |
| Decile 8 | 0.000867 |
| Decile 7 | 0.000835 |
| Decile 6 | 0.000809 |
| Median | 0.000787 |
| Decile 4 | 0.000766 |
| Decile 3 | 0.000747 |
| Decile 2 | 0.000726 |
| Decile 1 | 0.000701 |
| Minimum | 0.000611 |
|
|
- Mean = 0.000798751
- Std.dev = 8.37589e-05
- 12 items above graph maximum of 0.001118
|
Notes
Mean MD (mean diffusivity) in pontine crossing tract on FA (fractional anisotropy) skeleton (from dMRI data)
0 Related Data-Fields
There are no related data-fields
0 Resources
There are no matching Resources
