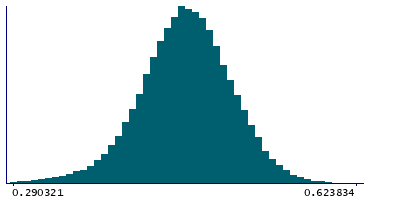
Data
48,846 items of data are available, covering 44,317 participants.
Defined-instances run from 2 to 3, labelled using Instancing
2.
Units of measurement are AU.
| Maximum | 0.738246 |
| Decile 9 | 0.512474 |
| Decile 8 | 0.493959 |
| Decile 7 | 0.480684 |
| Decile 6 | 0.469484 |
| Median | 0.458896 |
| Decile 4 | 0.44835 |
| Decile 3 | 0.436931 |
| Decile 2 | 0.423319 |
| Decile 1 | 0.402739 |
| Minimum | 0.062523 |
|
|
- Mean = 0.457647
- Std.dev = 0.044568
- 107 items below graph minimum of 0.293004
- 6 items above graph maximum of 0.622208
|
2 Instances
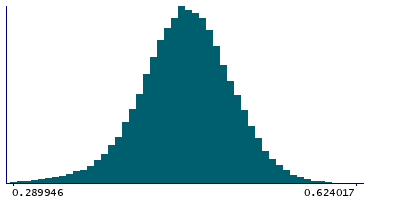
Instance 2 : Imaging visit (2014+)
44,085 participants, 44,085 items
| Maximum | 0.696695 |
| Decile 9 | 0.512468 |
| Decile 8 | 0.49378 |
| Decile 7 | 0.480612 |
| Decile 6 | 0.46939 |
| Median | 0.458715 |
| Decile 4 | 0.448131 |
| Decile 3 | 0.436771 |
| Decile 2 | 0.423167 |
| Decile 1 | 0.402521 |
| Minimum | 0.062523 |
|
|
- Mean = 0.457521
- Std.dev = 0.0446221
- 94 items below graph minimum of 0.292574
- 5 items above graph maximum of 0.622416
|
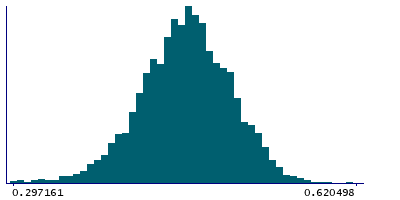
Instance 3 : First repeat imaging visit (2019+)
4,761 participants, 4,761 items
| Maximum | 0.738246 |
| Decile 9 | 0.512701 |
| Decile 8 | 0.495576 |
| Decile 7 | 0.481202 |
| Decile 6 | 0.470247 |
| Median | 0.460614 |
| Decile 4 | 0.450001 |
| Decile 3 | 0.439086 |
| Decile 2 | 0.42455 |
| Decile 1 | 0.405011 |
| Minimum | 0.208532 |
|
|
- Mean = 0.458815
- Std.dev = 0.0440474
- 14 items below graph minimum of 0.297321
- 1 item above graph maximum of 0.620391
|
Notes
Mean FA (fractional anisotropy) in superior fronto-occipital fasciculus (right) on FA skeleton (from dMRI data)
0 Related Data-Fields
There are no related data-fields
0 Resources
There are no matching Resources
