Data
48,846 items of data are available, covering 44,317 participants.
Defined-instances run from 2 to 3, labelled using Instancing
2.
Units of measurement are AU.
| Maximum | 0.794382 |
| Decile 9 | 0.73906 |
| Decile 8 | 0.729461 |
| Decile 7 | 0.722316 |
| Decile 6 | 0.716102 |
| Median | 0.710169 |
| Decile 4 | 0.70413 |
| Decile 3 | 0.697336 |
| Decile 2 | 0.689318 |
| Decile 1 | 0.677589 |
| Minimum | 0 |
|
|
- Mean = 0.708718
- Std.dev = 0.0262838
- 139 items below graph minimum of 0.616118
|
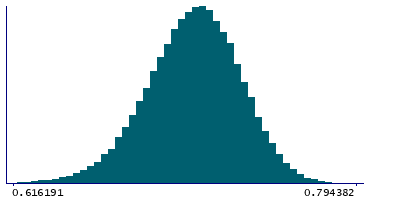
2 Instances
Instance 2 : Imaging visit (2014+)
44,085 participants, 44,085 items
| Maximum | 0.794382 |
| Decile 9 | 0.738941 |
| Decile 8 | 0.729287 |
| Decile 7 | 0.722117 |
| Decile 6 | 0.715889 |
| Median | 0.709961 |
| Decile 4 | 0.703945 |
| Decile 3 | 0.697124 |
| Decile 2 | 0.689078 |
| Decile 1 | 0.677232 |
| Minimum | 0 |
|

|
- Mean = 0.708476
- Std.dev = 0.0264942
- 128 items below graph minimum of 0.615523
|
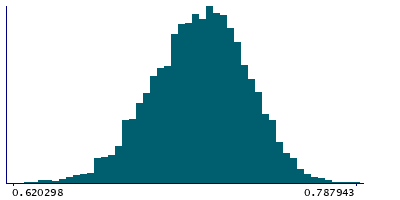
Instance 3 : First repeat imaging visit (2019+)
4,761 participants, 4,761 items
| Maximum | 0.787943 |
| Decile 9 | 0.740356 |
| Decile 8 | 0.730857 |
| Decile 7 | 0.724158 |
| Decile 6 | 0.718106 |
| Median | 0.712125 |
| Decile 4 | 0.706045 |
| Decile 3 | 0.699608 |
| Decile 2 | 0.69131 |
| Decile 1 | 0.680361 |
| Minimum | 0.497036 |
|
|
- Mean = 0.710958
- Std.dev = 0.0241346
- 11 items below graph minimum of 0.620366
|
Notes
Mean FA (fractional anisotropy) in superior cerebellar peduncle (left) on FA skeleton (from dMRI data)
0 Related Data-Fields
There are no related data-fields
0 Resources
There are no matching Resources
