Data
45,555 items of data are available, covering 41,257 participants.
Defined-instances run from 2 to 3, labelled using Instancing
2.
| Maximum | 3.90657 |
| Decile 9 | 0.389296 |
| Decile 8 | 0.321484 |
| Decile 7 | 0.281366 |
| Decile 6 | 0.251803 |
| Median | 0.226829 |
| Decile 4 | 0.205333 |
| Decile 3 | 0.185163 |
| Decile 2 | 0.163983 |
| Decile 1 | 0.1395 |
| Minimum | 0.0462848 |
|
|
- Mean = 0.252025
- Std.dev = 0.11917
- 523 items above graph maximum of 0.639091
|
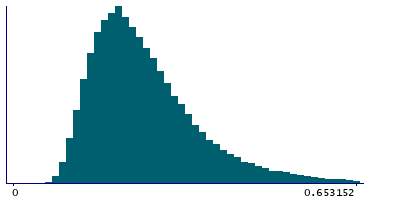
2 Instances
Instance 2 : Imaging visit (2014+)
40,893 participants, 40,893 items
| Maximum | 3.90657 |
| Decile 9 | 0.390597 |
| Decile 8 | 0.322172 |
| Decile 7 | 0.28182 |
| Decile 6 | 0.252107 |
| Median | 0.227017 |
| Decile 4 | 0.205458 |
| Decile 3 | 0.185251 |
| Decile 2 | 0.163962 |
| Decile 1 | 0.139512 |
| Minimum | 0.050607 |
|

|
- Mean = 0.25255
- Std.dev = 0.119836
- 475 items above graph maximum of 0.641683
|
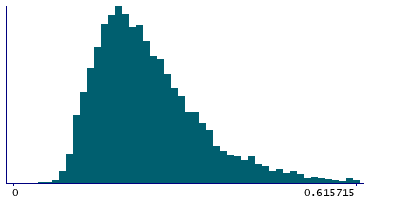
Instance 3 : First repeat imaging visit (2019+)
4,662 participants, 4,662 items
| Maximum | 2.94465 |
| Decile 9 | 0.377613 |
| Decile 8 | 0.314666 |
| Decile 7 | 0.276672 |
| Decile 6 | 0.248994 |
| Median | 0.225317 |
| Decile 4 | 0.203528 |
| Decile 3 | 0.1842 |
| Decile 2 | 0.164174 |
| Decile 1 | 0.13951 |
| Minimum | 0.0462848 |
|
|
- Mean = 0.247425
- Std.dev = 0.113054
- 45 items above graph maximum of 0.615715
|
Notes
90th percentile of the relative head motion from tfMRI calculated by FEAT
0 Related Data-Fields
There are no related data-fields