Data
45,555 items of data are available, covering 41,257 participants.
Defined-instances run from 2 to 3, labelled using Instancing
2.
| Maximum | 1.15456 |
| Decile 9 | 0.228499 |
| Decile 8 | 0.189163 |
| Decile 7 | 0.166254 |
| Decile 6 | 0.148831 |
| Median | 0.134492 |
| Decile 4 | 0.122044 |
| Decile 3 | 0.110006 |
| Decile 2 | 0.0978194 |
| Decile 1 | 0.0836597 |
| Minimum | 0.0309171 |
|

|
- Mean = 0.148416
- Std.dev = 0.0652818
- 460 items above graph maximum of 0.373339
|
2 Instances
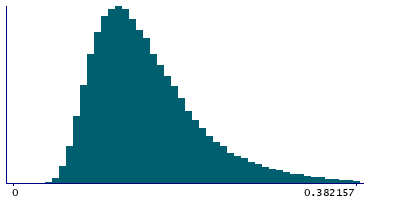
Instance 2 : Imaging visit (2014+)
40,893 participants, 40,893 items
| Maximum | 1.15456 |
| Decile 9 | 0.229566 |
| Decile 8 | 0.189757 |
| Decile 7 | 0.166594 |
| Decile 6 | 0.149052 |
| Median | 0.134685 |
| Decile 4 | 0.122226 |
| Decile 3 | 0.110021 |
| Decile 2 | 0.0977513 |
| Decile 1 | 0.0836091 |
| Minimum | 0.0329789 |
|
|
- Mean = 0.148746
- Std.dev = 0.0657513
- 413 items above graph maximum of 0.375523
|
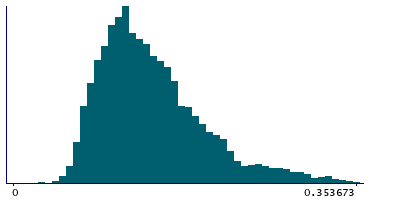
Instance 3 : First repeat imaging visit (2019+)
4,662 participants, 4,662 items
| Maximum | 1.06056 |
| Decile 9 | 0.218819 |
| Decile 8 | 0.184377 |
| Decile 7 | 0.162387 |
| Decile 6 | 0.146944 |
| Median | 0.13316 |
| Decile 4 | 0.120335 |
| Decile 3 | 0.109751 |
| Decile 2 | 0.0982537 |
| Decile 1 | 0.0839645 |
| Minimum | 0.0309171 |
|
|
- Mean = 0.145514
- Std.dev = 0.0609324
- 42 items above graph maximum of 0.353673
|