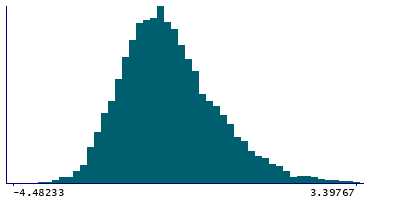
Data
8,353 items of data are available, covering 8,353 participants.
Defined-instances run from 2 to 3, labelled using Instancing
2.
Units of measurement are Std.Devs.
| Maximum | 4.58605 |
| Decile 9 | 0.6 |
| Decile 8 | -0.00452827 |
| Decile 7 | -0.43601 |
| Decile 6 | -0.751857 |
| Median | -1.00859 |
| Decile 4 | -1.27574 |
| Decile 3 | -1.52346 |
| Decile 2 | -1.8 |
| Decile 1 | -2.19754 |
| Minimum | -4.48233 |
|
|
- Mean = -0.886321
- Std.dev = 1.11631
- 20 items above graph maximum of 3.39754
|
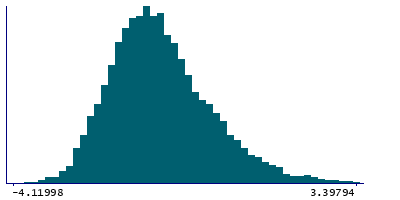
2 Instances
Instance 2 : Imaging visit (2014+)
8,275 participants, 8,275 items
| Maximum | 4.58605 |
| Decile 9 | 0.6 |
| Decile 8 | -0.00169603 |
| Decile 7 | -0.43601 |
| Decile 6 | -0.751267 |
| Median | -1.0102 |
| Decile 4 | -1.27666 |
| Decile 3 | -1.52403 |
| Decile 2 | -1.8 |
| Decile 1 | -2.19794 |
| Minimum | -4.11998 |
|
|
- Mean = -0.88568
- Std.dev = 1.11702
- 20 items above graph maximum of 3.39794
|
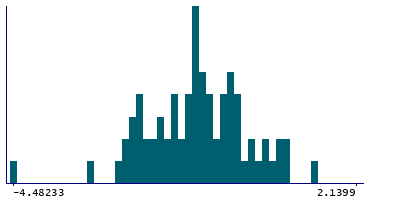
Instance 3 : First repeat imaging visit (2019+)
78 participants, 78 items
| Maximum | 2.1399 |
| Decile 9 | 0.421814 |
| Decile 8 | -0.210334 |
| Decile 7 | -0.41786 |
| Decile 6 | -0.779461 |
| Median | -0.945885 |
| Decile 4 | -1.05961 |
| Decile 3 | -1.37266 |
| Decile 2 | -1.73638 |
| Decile 1 | -2.13657 |
| Minimum | -4.48233 |
|
|
- Mean = -0.954319
- Std.dev = 1.03674
- 1 item above graph maximum of 2.1399
|