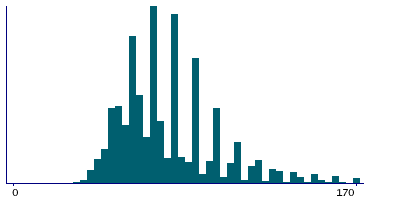
Data
303,421 items of data are available, covering 211,740 participants.
Defined-instances run from 0 to 1, labelled using Instancing
178.
Units of measurement are deciseconds.
| Maximum | 9999 |
| Decile 9 | 110 |
| Decile 8 | 97 |
| Decile 7 | 88 |
| Decile 6 | 80 |
| Median | 70 |
| Decile 4 | 70 |
| Decile 3 | 60 |
| Decile 2 | 58 |
| Decile 1 | 50 |
| Minimum | 8 |
|
|
- There are 451 distinct values.
- Mean = 79.4209
- Std.dev = 51.8758
- 4511 items above graph maximum of 170
|
2 Instances
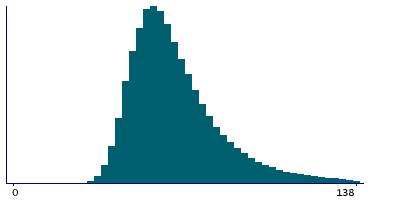
Instance 0 : Assessment run 2014
123,141 participants, 123,141 items
| Maximum | 9999 |
| Decile 9 | 92 |
| Decile 8 | 79 |
| Decile 7 | 71 |
| Decile 6 | 66 |
| Median | 62 |
| Decile 4 | 58 |
| Decile 3 | 55 |
| Decile 2 | 51 |
| Decile 1 | 46 |
| Minimum | 8 |
|
|
- There are 399 distinct values.
- Mean = 67.869
- Std.dev = 67.3382
- 2016 items above graph maximum of 138
|
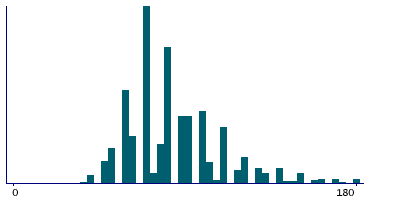
Instance 1 : Assessment run 2021
180,280 participants, 180,280 items
| Maximum | 1080 |
| Decile 9 | 120 |
| Decile 8 | 100 |
| Decile 7 | 90 |
| Decile 6 | 90 |
| Median | 80 |
| Decile 4 | 70 |
| Decile 3 | 70 |
| Decile 2 | 60 |
| Decile 1 | 60 |
| Minimum | 20 |
|
|
- There are 89 distinct values.
- Mean = 87.3115
- Std.dev = 35.7573
- 2933 items above graph maximum of 180
|
Notes
Indicates how long a participant viewed question FI2 before selecting their answer and clicking Next.
1 Related Data-Field
| Field ID | Description | Relationship |
|---|
| 20167 | FI2 : identify largest number | Current Field is the duration spent viewing before entering the answer in Field 20167 |