Data
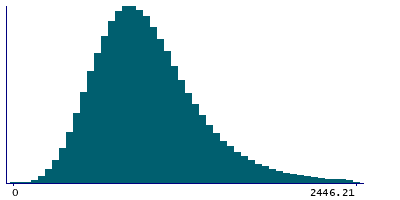
458,305 items of data are available, covering 210,868 participants.
Defined-instances run from 0 to 4, labelled using Instancing
1.
Units of measurement are mg.
| Maximum | 8086.33 |
| Decile 9 | 1486.83 |
| Decile 8 | 1252.44 |
| Decile 7 | 1112.25 |
| Decile 6 | 1005.61 |
| Median | 913.71 |
| Decile 4 | 827.43 |
| Decile 3 | 741.335 |
| Decile 2 | 646.95 |
| Decile 1 | 527.46 |
| Minimum | 0 |
|
|
- Mean = 982.016
- Std.dev = 447.79
- 4776 items above graph maximum of 2446.21
|
5 Instances
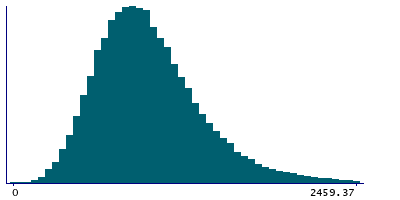
Instance 0 : Conducted in assessment centre, April 2009 to September 2010.
70,688 participants, 70,688 items
| Maximum | 8011.52 |
| Decile 9 | 1507.94 |
| Decile 8 | 1264.38 |
| Decile 7 | 1120.43 |
| Decile 6 | 1009.28 |
| Median | 914.88 |
| Decile 4 | 825.16 |
| Decile 3 | 736.605 |
| Decile 2 | 639.135 |
| Decile 1 | 514.875 |
| Minimum | 0 |
|
|
- Mean = 987.049
- Std.dev = 470.294
- 807 items above graph maximum of 2501.01
|
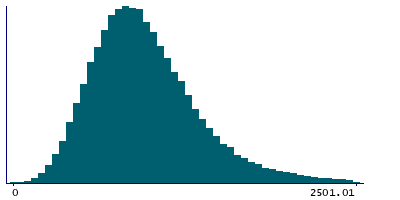
Instance 1 : On-line cycle 1, February 2011 to April 2011.
100,517 participants, 100,517 items
| Maximum | 7033.75 |
| Decile 9 | 1498.42 |
| Decile 8 | 1265.24 |
| Decile 7 | 1125.31 |
| Decile 6 | 1017.73 |
| Median | 926.07 |
| Decile 4 | 838.935 |
| Decile 3 | 751.865 |
| Decile 2 | 657.505 |
| Decile 1 | 537.465 |
| Minimum | 0 |
|
|
- Mean = 992.398
- Std.dev = 445.123
- 985 items above graph maximum of 2459.37
|
Instance 2 : On-line cycle 2, June 2011 to September 2011.
83,200 participants, 83,200 items
| Maximum | 8086.33 |
| Decile 9 | 1462.75 |
| Decile 8 | 1230.37 |
| Decile 7 | 1093.37 |
| Decile 6 | 989.3 |
| Median | 899.3 |
| Decile 4 | 815.13 |
| Decile 3 | 730.76 |
| Decile 2 | 640.67 |
| Decile 1 | 523.5 |
| Minimum | 0 |
|

|
- Mean = 968.13
- Std.dev = 442.046
- 924 items above graph maximum of 2402
|
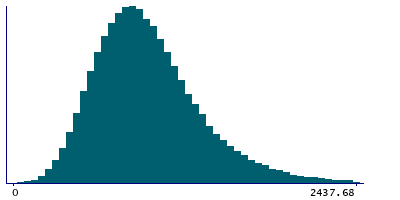
Instance 3 : On-line cycle 3, October 2011 to December 2011.
103,698 participants, 103,698 items
| Maximum | 7172.47 |
| Decile 9 | 1481.16 |
| Decile 8 | 1247.63 |
| Decile 7 | 1107.23 |
| Decile 6 | 1001.27 |
| Median | 909.72 |
| Decile 4 | 824.235 |
| Decile 3 | 738.135 |
| Decile 2 | 643.3 |
| Decile 1 | 524.64 |
| Minimum | 0 |
|
|
- Mean = 976.398
- Std.dev = 439.696
- 1010 items above graph maximum of 2437.68
|
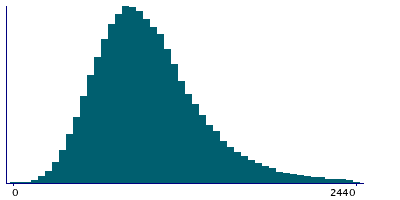
Instance 4 : On-line cycle 4, April 2012 to June 2012.
100,202 participants, 100,202 items
| Maximum | 7705.8 |
| Decile 9 | 1486.57 |
| Decile 8 | 1253.62 |
| Decile 7 | 1113.04 |
| Decile 6 | 1009.72 |
| Median | 916.96 |
| Decile 4 | 831.03 |
| Decile 3 | 746.77 |
| Decile 2 | 652.11 |
| Decile 1 | 533.145 |
| Minimum | 0 |
|
|
- Mean = 985.395
- Std.dev = 446.855
- 1048 items above graph maximum of 2440
|

