Data
458,305 items of data are available, covering 210,868 participants.
Defined-instances run from 0 to 4, labelled using Instancing
1.
Units of measurement are ug.
| Maximum | 52829.4 |
| Decile 9 | 6821.44 |
| Decile 8 | 5022.14 |
| Decile 7 | 4085.17 |
| Decile 6 | 2991.98 |
| Median | 2245.94 |
| Decile 4 | 1543.12 |
| Decile 3 | 1060.45 |
| Decile 2 | 660.81 |
| Decile 1 | 363.44 |
| Minimum | 0 |
|

|
- Mean = 3097.84
- Std.dev = 2996.2
- 4915 items above graph maximum of 13279.4
|
5 Instances
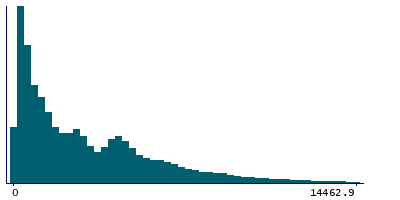
Instance 0 : Conducted in assessment centre, April 2009 to September 2010.
70,688 participants, 70,688 items
| Maximum | 47406.1 |
| Decile 9 | 7382.21 |
| Decile 8 | 5320.81 |
| Decile 7 | 4239.2 |
| Decile 6 | 3060.24 |
| Median | 2206.39 |
| Decile 4 | 1443.26 |
| Decile 3 | 933.845 |
| Decile 2 | 549.23 |
| Decile 1 | 301.48 |
| Minimum | 0 |
|
|
- Mean = 3211.14
- Std.dev = 3272.56
- 746 items above graph maximum of 14462.9
|
Instance 1 : On-line cycle 1, February 2011 to April 2011.
100,517 participants, 100,517 items
| Maximum | 52829.4 |
| Decile 9 | 6959.22 |
| Decile 8 | 5123.84 |
| Decile 7 | 4203.43 |
| Decile 6 | 3144.45 |
| Median | 2365.31 |
| Decile 4 | 1619.36 |
| Decile 3 | 1108.91 |
| Decile 2 | 694.6 |
| Decile 1 | 380.09 |
| Minimum | 0 |
|

|
- Mean = 3191.32
- Std.dev = 3055.57
- 1071 items above graph maximum of 13538.3
|
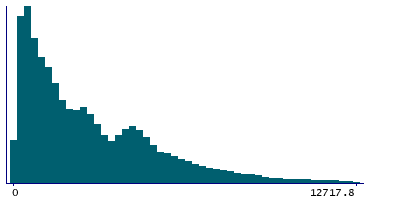
Instance 2 : On-line cycle 2, June 2011 to September 2011.
83,200 participants, 83,200 items
| Maximum | 46729.1 |
| Decile 9 | 6549.16 |
| Decile 8 | 4854.28 |
| Decile 7 | 3881.77 |
| Decile 6 | 2858.64 |
| Median | 2146.51 |
| Decile 4 | 1513.73 |
| Decile 3 | 1062.84 |
| Decile 2 | 676.95 |
| Decile 1 | 380.5 |
| Minimum | 0 |
|
|
- Mean = 2982.96
- Std.dev = 2865.75
- 925 items above graph maximum of 12717.8
|
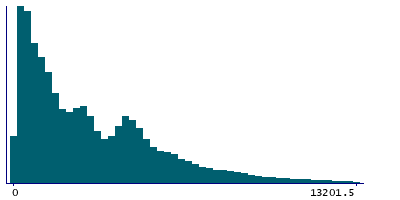
Instance 3 : On-line cycle 3, October 2011 to December 2011.
103,698 participants, 103,698 items
| Maximum | 52510.5 |
| Decile 9 | 6787.56 |
| Decile 8 | 5033.53 |
| Decile 7 | 4144.17 |
| Decile 6 | 3046.42 |
| Median | 2314.26 |
| Decile 4 | 1584.87 |
| Decile 3 | 1093.12 |
| Decile 2 | 688.5 |
| Decile 1 | 373.585 |
| Minimum | 0 |
|
|
- Mean = 3116.93
- Std.dev = 2946.78
- 1097 items above graph maximum of 13201.5
|
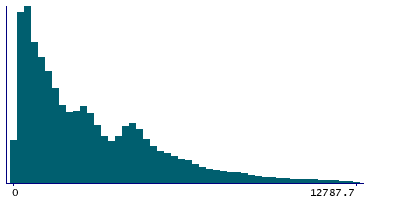
Instance 4 : On-line cycle 4, April 2012 to June 2012.
100,202 participants, 100,202 items
| Maximum | 51772.4 |
| Decile 9 | 6581.25 |
| Decile 8 | 4871.93 |
| Decile 7 | 3934.64 |
| Decile 6 | 2887.45 |
| Median | 2180.57 |
| Decile 4 | 1519.16 |
| Decile 3 | 1054.23 |
| Decile 2 | 668.65 |
| Decile 1 | 374.825 |
| Minimum | 0 |
|
|
- Mean = 2999.76
- Std.dev = 2880.06
- 1021 items above graph maximum of 12787.7
|

