Data
458,305 items of data are available, covering 210,868 participants.
Defined-instances run from 0 to 4, labelled using Instancing
1.
Units of measurement are g.
| Maximum | 252.17 |
| Decile 9 | 49.22 |
| Decile 8 | 40.58 |
| Decile 7 | 35.22 |
| Decile 6 | 31.05 |
| Median | 27.54 |
| Decile 4 | 24.29 |
| Decile 3 | 21.12 |
| Decile 2 | 17.77 |
| Decile 1 | 13.66 |
| Minimum | 0 |
|

|
- Mean = 30.0804
- Std.dev = 15.3154
- 3103 items above graph maximum of 84.78
|
5 Instances
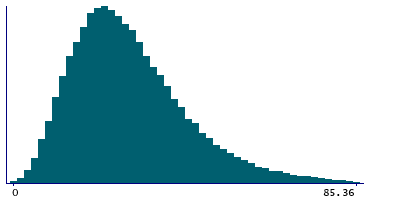
Instance 0 : Conducted in assessment centre, April 2009 to September 2010.
70,688 participants, 70,688 items
| Maximum | 252.17 |
| Decile 9 | 49.065 |
| Decile 8 | 40.06 |
| Decile 7 | 34.6 |
| Decile 6 | 30.37 |
| Median | 26.79 |
| Decile 4 | 23.5 |
| Decile 3 | 20.35 |
| Decile 2 | 16.95 |
| Decile 1 | 12.77 |
| Minimum | 0 |
|
|
- Mean = 29.5189
- Std.dev = 15.8209
- 551 items above graph maximum of 85.36
|
Instance 1 : On-line cycle 1, February 2011 to April 2011.
100,517 participants, 100,517 items
| Maximum | 207.09 |
| Decile 9 | 48.89 |
| Decile 8 | 40.45 |
| Decile 7 | 35.15 |
| Decile 6 | 31.08 |
| Median | 27.6 |
| Decile 4 | 24.4 |
| Decile 3 | 21.27 |
| Decile 2 | 17.92 |
| Decile 1 | 13.84 |
| Minimum | 0 |
|

|
- Mean = 30.0631
- Std.dev = 15.086
- 676 items above graph maximum of 83.94
|
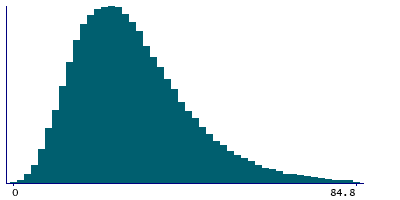
Instance 2 : On-line cycle 2, June 2011 to September 2011.
83,200 participants, 83,200 items
| Maximum | 225.47 |
| Decile 9 | 49.18 |
| Decile 8 | 40.49 |
| Decile 7 | 35.13 |
| Decile 6 | 30.97 |
| Median | 27.44 |
| Decile 4 | 24.2 |
| Decile 3 | 20.96 |
| Decile 2 | 17.57 |
| Decile 1 | 13.56 |
| Minimum | 0 |
|
|
- Mean = 29.9895
- Std.dev = 15.3489
- 570 items above graph maximum of 84.8
|
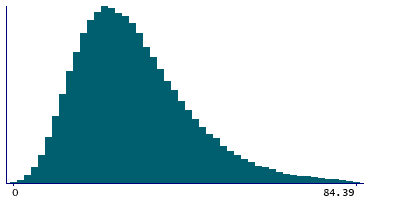
Instance 3 : On-line cycle 3, October 2011 to December 2011.
103,698 participants, 103,698 items
| Maximum | 209.06 |
| Decile 9 | 49.16 |
| Decile 8 | 40.57 |
| Decile 7 | 35.21 |
| Decile 6 | 31.11 |
| Median | 27.65 |
| Decile 4 | 24.41 |
| Decile 3 | 21.29 |
| Decile 2 | 17.97 |
| Decile 1 | 13.93 |
| Minimum | 0 |
|
|
- Mean = 30.1226
- Std.dev = 15.0305
- 646 items above graph maximum of 84.39
|
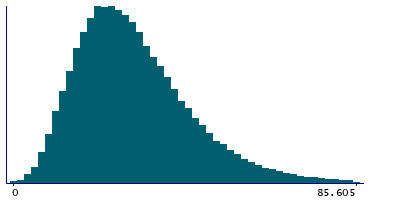
Instance 4 : On-line cycle 4, April 2012 to June 2012.
100,202 participants, 100,202 items
| Maximum | 200.54 |
| Decile 9 | 49.79 |
| Decile 8 | 41.16 |
| Decile 7 | 35.76 |
| Decile 6 | 31.52 |
| Median | 27.96 |
| Decile 4 | 24.68 |
| Decile 3 | 21.48 |
| Decile 2 | 18.12 |
| Decile 1 | 13.975 |
| Minimum | 0 |
|
|
- Mean = 30.5256
- Std.dev = 15.431
- 654 items above graph maximum of 85.605
|

