Data
458,305 items of data are available, covering 210,868 participants.
Defined-instances run from 0 to 4, labelled using Instancing
1.
Units of measurement are g.
| Maximum | 801.85 |
| Decile 9 | 118.01 |
| Decile 8 | 102.72 |
| Decile 7 | 93.31 |
| Decile 6 | 85.98 |
| Median | 79.49 |
| Decile 4 | 73.24 |
| Decile 3 | 66.68 |
| Decile 2 | 59.06 |
| Decile 1 | 48.79 |
| Minimum | 0 |
|

|
- Mean = 82.4114
- Std.dev = 29.7191
- 2969 items above graph maximum of 187.23
|
5 Instances
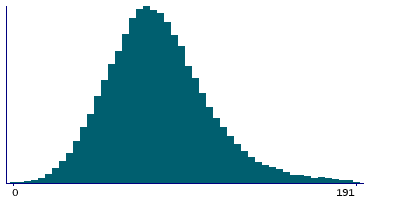
Instance 0 : Conducted in assessment centre, April 2009 to September 2010.
70,688 participants, 70,688 items
| Maximum | 801.85 |
| Decile 9 | 118.86 |
| Decile 8 | 102.91 |
| Decile 7 | 93.095 |
| Decile 6 | 85.43 |
| Median | 78.62 |
| Decile 4 | 72.05 |
| Decile 3 | 65.3 |
| Decile 2 | 57.33 |
| Decile 1 | 46.72 |
| Minimum | 0 |
|
|
- Mean = 81.7997
- Std.dev = 31.3256
- 498 items above graph maximum of 191
|
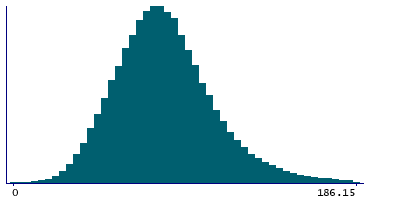
Instance 1 : On-line cycle 1, February 2011 to April 2011.
100,517 participants, 100,517 items
| Maximum | 636.08 |
| Decile 9 | 117.9 |
| Decile 8 | 102.93 |
| Decile 7 | 93.7 |
| Decile 6 | 86.525 |
| Median | 80.1 |
| Decile 4 | 73.91 |
| Decile 3 | 67.405 |
| Decile 2 | 59.83 |
| Decile 1 | 49.65 |
| Minimum | 0 |
|
|
- Mean = 82.8776
- Std.dev = 29.2606
- 625 items above graph maximum of 186.15
|
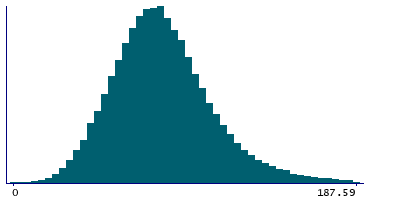
Instance 2 : On-line cycle 2, June 2011 to September 2011.
83,200 participants, 83,200 items
| Maximum | 792.06 |
| Decile 9 | 118.24 |
| Decile 8 | 102.8 |
| Decile 7 | 93.25 |
| Decile 6 | 85.86 |
| Median | 79.43 |
| Decile 4 | 73.14 |
| Decile 3 | 66.6 |
| Decile 2 | 59.11 |
| Decile 1 | 48.89 |
| Minimum | 0 |
|
|
- Mean = 82.4963
- Std.dev = 29.9788
- 581 items above graph maximum of 187.59
|
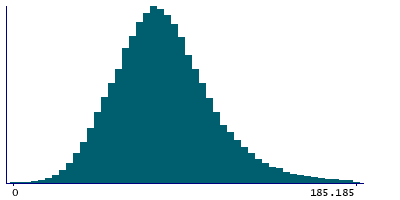
Instance 3 : On-line cycle 3, October 2011 to December 2011.
103,698 participants, 103,698 items
| Maximum | 565.45 |
| Decile 9 | 117.08 |
| Decile 8 | 102.13 |
| Decile 7 | 92.91 |
| Decile 6 | 85.75 |
| Median | 79.36 |
| Decile 4 | 73.26 |
| Decile 3 | 66.74 |
| Decile 2 | 59.22 |
| Decile 1 | 48.975 |
| Minimum | 0 |
|
|
- Mean = 82.0668
- Std.dev = 28.8493
- 616 items above graph maximum of 185.185
|
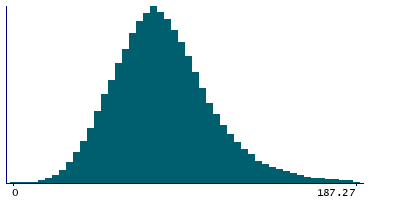
Instance 4 : On-line cycle 4, April 2012 to June 2012.
100,202 participants, 100,202 items
| Maximum | 665.63 |
| Decile 9 | 118.19 |
| Decile 8 | 102.88 |
| Decile 7 | 93.485 |
| Decile 6 | 86.14 |
| Median | 79.61 |
| Decile 4 | 73.465 |
| Decile 3 | 66.93 |
| Decile 2 | 59.31 |
| Decile 1 | 49.11 |
| Minimum | 0 |
|
|
- Mean = 82.6613
- Std.dev = 29.6706
- 656 items above graph maximum of 187.27
|

