Data
458,305 items of data are available, covering 210,868 participants.
Defined-instances run from 0 to 4, labelled using Instancing
1.
Units of measurement are KJ.
| Maximum | 78205.7 |
| Decile 9 | 12486.8 |
| Decile 8 | 10899.2 |
| Decile 7 | 9904.09 |
| Decile 6 | 9125.5 |
| Median | 8461.19 |
| Decile 4 | 7829.43 |
| Decile 3 | 7194.33 |
| Decile 2 | 6487.21 |
| Decile 1 | 5551.39 |
| Minimum | 0 |
|

|
- Mean = 8845.04
- Std.dev = 3032.61
- 3256 items above graph maximum of 19422.1
|
5 Instances
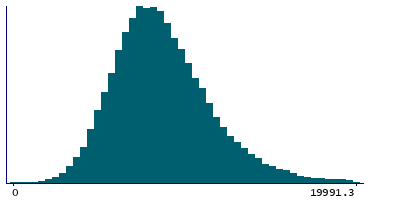
Instance 0 : Conducted in assessment centre, April 2009 to September 2010.
70,688 participants, 70,688 items
| Maximum | 78205.7 |
| Decile 9 | 12669.2 |
| Decile 8 | 10973.1 |
| Decile 7 | 9920.4 |
| Decile 6 | 9100.73 |
| Median | 8405.02 |
| Decile 4 | 7739.91 |
| Decile 3 | 7080.55 |
| Decile 2 | 6339 |
| Decile 1 | 5347.19 |
| Minimum | 0 |
|
|
- Mean = 8825.59
- Std.dev = 3229.37
- 553 items above graph maximum of 19991.3
|
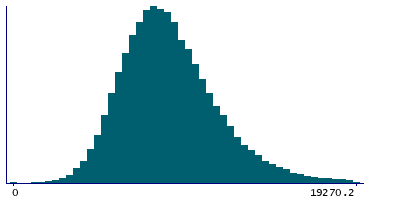
Instance 1 : On-line cycle 1, February 2011 to April 2011.
100,517 participants, 100,517 items
| Maximum | 47523.7 |
| Decile 9 | 12446.9 |
| Decile 8 | 10905.3 |
| Decile 7 | 9924.62 |
| Decile 6 | 9153.61 |
| Median | 8499.17 |
| Decile 4 | 7872.91 |
| Decile 3 | 7243.79 |
| Decile 2 | 6538.95 |
| Decile 1 | 5623.54 |
| Minimum | 0 |
|
|
- Mean = 8869.55
- Std.dev = 2979.13
- 675 items above graph maximum of 19270.2
|
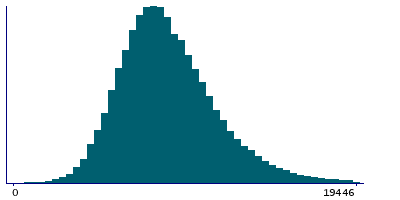
Instance 2 : On-line cycle 2, June 2011 to September 2011.
83,200 participants, 83,200 items
| Maximum | 68418.5 |
| Decile 9 | 12519.7 |
| Decile 8 | 10914.2 |
| Decile 7 | 9918.2 |
| Decile 6 | 9140.79 |
| Median | 8462.79 |
| Decile 4 | 7840.63 |
| Decile 3 | 7212.16 |
| Decile 2 | 6519.17 |
| Decile 1 | 5593.41 |
| Minimum | 0 |
|
|
- Mean = 8865.03
- Std.dev = 3023.79
- 577 items above graph maximum of 19446
|
Instance 3 : On-line cycle 3, October 2011 to December 2011.
103,698 participants, 103,698 items
| Maximum | 51266.1 |
| Decile 9 | 12378 |
| Decile 8 | 10811.5 |
| Decile 7 | 9834.37 |
| Decile 6 | 9069.01 |
| Median | 8421.99 |
| Decile 4 | 7798.91 |
| Decile 3 | 7156.69 |
| Decile 2 | 6456.85 |
| Decile 1 | 5537.63 |
| Minimum | 0 |
|

|
- Mean = 8782.65
- Std.dev = 2950.58
- 667 items above graph maximum of 19218.3
|
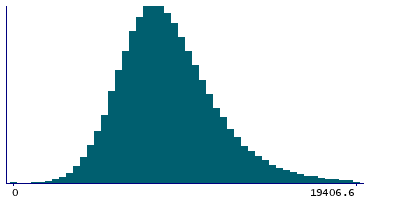
Instance 4 : On-line cycle 4, April 2012 to June 2012.
100,202 participants, 100,202 items
| Maximum | 60976.3 |
| Decile 9 | 12503 |
| Decile 8 | 10920 |
| Decile 7 | 9934.13 |
| Decile 6 | 9164.23 |
| Median | 8500.74 |
| Decile 4 | 7875.34 |
| Decile 3 | 7240.02 |
| Decile 2 | 6535.32 |
| Decile 1 | 5599.4 |
| Minimum | 0 |
|
|
- Mean = 8882.14
- Std.dev = 3032.46
- 746 items above graph maximum of 19406.6
|

