Data
101,131 items of data are available, covering 87,900 participants.
Defined-instances run from 2 to 3, labelled using Instancing
2.
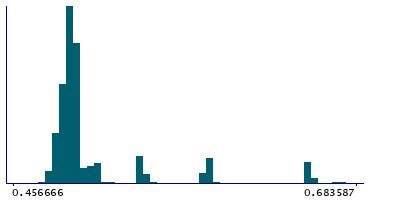
| Maximum | 1.14048 |
| Decile 9 | 0.588481 |
| Decile 8 | 0.541 |
| Decile 7 | 0.499826 |
| Decile 6 | 0.497486 |
| Median | 0.496066 |
| Decile 4 | 0.494817 |
| Decile 3 | 0.492687 |
| Decile 2 | 0.490641 |
| Decile 1 | 0.487151 |
| Minimum | 0.456666 |
|

|
- Mean = 0.527566
- Std.dev = 0.0891854
- 5129 items above graph maximum of 0.689811
|
2 Instances
Instance 2 : Imaging visit (2014+)
81,397 participants, 81,397 items
| Maximum | 1.14048 |
| Decile 9 | 0.588481 |
| Decile 8 | 0.541 |
| Decile 7 | 0.499826 |
| Decile 6 | 0.497486 |
| Median | 0.496066 |
| Decile 4 | 0.494811 |
| Decile 3 | 0.492687 |
| Decile 2 | 0.49064 |
| Decile 1 | 0.487121 |
| Minimum | 0.456666 |
|
|
- Mean = 0.527612
- Std.dev = 0.0890914
- 4121 items above graph maximum of 0.68984
|
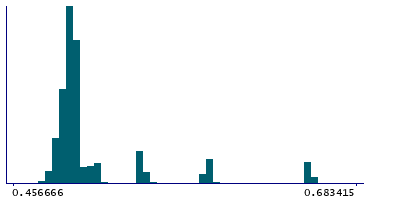
Instance 3 : First repeat imaging visit (2019+)
19,734 participants, 19,734 items
| Maximum | 1.14048 |
| Decile 9 | 0.58564 |
| Decile 8 | 0.541 |
| Decile 7 | 0.499826 |
| Decile 6 | 0.497486 |
| Median | 0.496066 |
| Decile 4 | 0.494817 |
| Decile 3 | 0.492687 |
| Decile 2 | 0.490641 |
| Decile 1 | 0.487293 |
| Minimum | 0.456666 |
|
|
- Mean = 0.527378
- Std.dev = 0.0895722
- 1019 items above graph maximum of 0.683986
|


