Data
87,996 items of data are available, covering 83,313 participants.
Defined-instances run from 2 to 3, labelled using Instancing
2.
Units of measurement are mm.
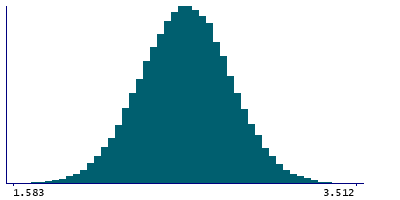
| Maximum | 3.689 |
| Decile 9 | 2.87 |
| Decile 8 | 2.761 |
| Decile 7 | 2.682 |
| Decile 6 | 2.615 |
| Median | 2.551 |
| Decile 4 | 2.487 |
| Decile 3 | 2.418 |
| Decile 2 | 2.337 |
| Decile 1 | 2.226 |
| Minimum | 1.417 |
|
|
- Mean = 2.54915
- Std.dev = 0.251371
- 9 items below graph minimum of 1.582
- 5 items above graph maximum of 3.514
|
2 Instances
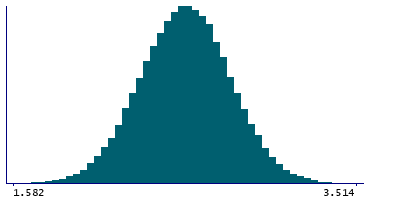
Instance 2 : Imaging visit (2014+)
83,241 participants, 83,241 items
| Maximum | 3.689 |
| Decile 9 | 2.87 |
| Decile 8 | 2.761 |
| Decile 7 | 2.682 |
| Decile 6 | 2.615 |
| Median | 2.55 |
| Decile 4 | 2.487 |
| Decile 3 | 2.417 |
| Decile 2 | 2.337 |
| Decile 1 | 2.225 |
| Minimum | 1.417 |
|
|
- Mean = 2.54895
- Std.dev = 0.251604
- 9 items below graph minimum of 1.58
- 4 items above graph maximum of 3.515
|
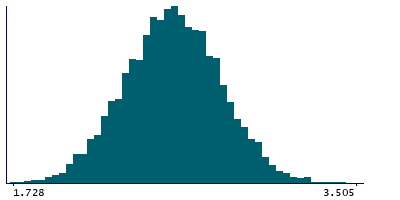
Instance 3 : First repeat imaging visit (2019+)
4,755 participants, 4,755 items
| Maximum | 3.519 |
| Decile 9 | 2.868 |
| Decile 8 | 2.761 |
| Decile 7 | 2.685 |
| Decile 6 | 2.616 |
| Median | 2.553 |
| Decile 4 | 2.492 |
| Decile 3 | 2.425 |
| Decile 2 | 2.342 |
| Decile 1 | 2.231 |
| Minimum | 1.728 |
|
|
- Mean = 2.55264
- Std.dev = 0.247228
- 1 item above graph maximum of 3.505
|
Notes
Mean thickness of transversetemporal in the left hemisphere generated by parcellation of the white surface using DKT parcellation
0 Related Data-Fields
There are no related data-fields
0 Resources
There are no matching Resources
