Data
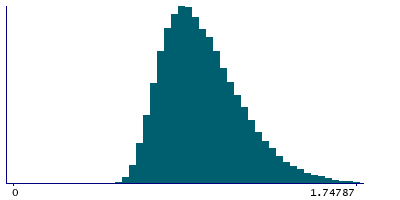
85,427 items of data are available, covering 80,881 participants.
Defined-instances run from 2 to 3, labelled using Instancing
2.
| Maximum | 2.83392 |
| Decile 9 | 1.24908 |
| Decile 8 | 1.13429 |
| Decile 7 | 1.05654 |
| Decile 6 | 0.996212 |
| Median | 0.942665 |
| Decile 4 | 0.893867 |
| Decile 3 | 0.846487 |
| Decile 2 | 0.795767 |
| Decile 1 | 0.735555 |
| Minimum | 0.446532 |
|

|
- Mean = 0.97265
- Std.dev = 0.205505
- 169 items above graph maximum of 1.7626
|
2 Instances
Instance 2 : Imaging visit (2014+)
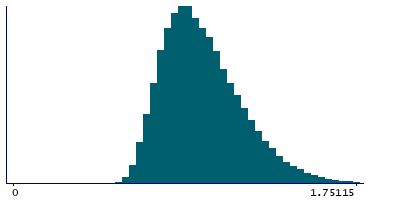
80,672 participants, 80,672 items
| Maximum | 2.83392 |
| Decile 9 | 1.25134 |
| Decile 8 | 1.13596 |
| Decile 7 | 1.05774 |
| Decile 6 | 0.99726 |
| Median | 0.943998 |
| Decile 4 | 0.894931 |
| Decile 3 | 0.847592 |
| Decile 2 | 0.797048 |
| Decile 1 | 0.736399 |
| Minimum | 0.446532 |
|

|
- Mean = 0.973976
- Std.dev = 0.205741
- 158 items above graph maximum of 1.76628
|
Instance 3 : First repeat imaging visit (2019+)
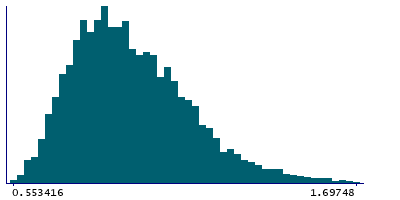
4,755 participants, 4,755 items
| Maximum | 2.4091 |
| Decile 9 | 1.20883 |
| Decile 8 | 1.10572 |
| Decile 7 | 1.03339 |
| Decile 6 | 0.975644 |
| Median | 0.921529 |
| Decile 4 | 0.87202 |
| Decile 3 | 0.828005 |
| Decile 2 | 0.778768 |
| Decile 1 | 0.720183 |
| Minimum | 0.553416 |
|

|
- Mean = 0.950148
- Std.dev = 0.200127
- 13 items above graph maximum of 1.69748
|
Notes
90th percentile of the S variable from DVARS from the uncleaned (before FIX) rfMRI
0 Related Data-Fields
There are no related data-fields


