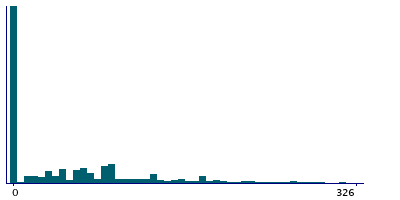
Data
457,927 items of data are available, covering 210,739 participants.
Defined-instances run from 0 to 4, labelled using Instancing
1.
Units of measurement are g.
| Maximum | 1884 |
| Decile 9 | 163 |
| Decile 8 | 101.5 |
| Decile 7 | 81 |
| Decile 6 | 59 |
| Median | 30 |
| Decile 4 | 0 |
| Decile 3 | 0 |
| Decile 2 | 0 |
| Decile 1 | 0 |
| Minimum | 0 |
|
|
- Mean = 58.438
- Std.dev = 81.303
- 6194 items above graph maximum of 326
|
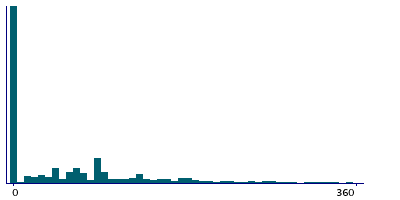
5 Instances
Instance 0 : Conducted in assessment centre, April 2009 to September 2010.
70,630 participants, 70,630 items
| Maximum | 1336 |
| Decile 9 | 180 |
| Decile 8 | 120 |
| Decile 7 | 90 |
| Decile 6 | 60 |
| Median | 30 |
| Decile 4 | 0 |
| Decile 3 | 0 |
| Decile 2 | 0 |
| Decile 1 | 0 |
| Minimum | 0 |
|
|
- Mean = 64.1794
- Std.dev = 90.0701
- 918 items above graph maximum of 360
|
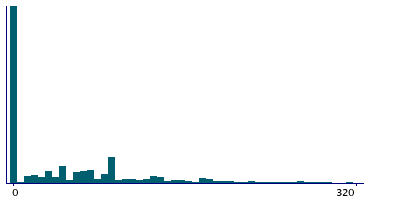
Instance 1 : On-line cycle 1, February 2011 to April 2011.
100,447 participants, 100,447 items
| Maximum | 1273 |
| Decile 9 | 160 |
| Decile 8 | 96 |
| Decile 7 | 77.5 |
| Decile 6 | 48.25 |
| Median | 22.5 |
| Decile 4 | 0 |
| Decile 3 | 0 |
| Decile 2 | 0 |
| Decile 1 | 0 |
| Minimum | 0 |
|
|
- Mean = 56.8674
- Std.dev = 80.0844
- 1320 items above graph maximum of 320
|
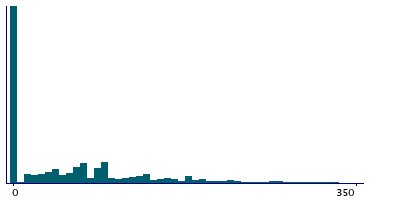
Instance 2 : On-line cycle 2, June 2011 to September 2011.
83,140 participants, 83,140 items
| Maximum | 1215 |
| Decile 9 | 175 |
| Decile 8 | 114 |
| Decile 7 | 90 |
| Decile 6 | 63.25 |
| Median | 35 |
| Decile 4 | 0 |
| Decile 3 | 0 |
| Decile 2 | 0 |
| Decile 1 | 0 |
| Minimum | 0 |
|
|
- Mean = 63.0261
- Std.dev = 83.299
- 922 items above graph maximum of 350
|
Instance 3 : On-line cycle 3, October 2011 to December 2011.
103,616 participants, 103,616 items
| Maximum | 1297 |
| Decile 9 | 150 |
| Decile 8 | 90 |
| Decile 7 | 70 |
| Decile 6 | 45 |
| Median | 22 |
| Decile 4 | 0 |
| Decile 3 | 0 |
| Decile 2 | 0 |
| Decile 1 | 0 |
| Minimum | 0 |
|
|
- Mean = 53.2668
- Std.dev = 76.0966
- 1492 items above graph maximum of 300
|
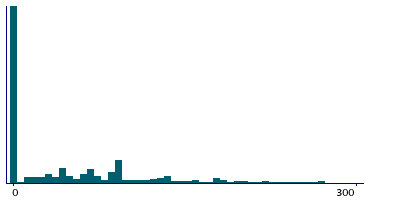
Instance 4 : On-line cycle 4, April 2012 to June 2012.
100,094 participants, 100,094 items
| Maximum | 1884 |
| Decile 9 | 160 |
| Decile 8 | 99 |
| Decile 7 | 77.5 |
| Decile 6 | 59 |
| Median | 30 |
| Decile 4 | 0 |
| Decile 3 | 0 |
| Decile 2 | 0 |
| Decile 1 | 0 |
| Minimum | 0 |
|

|
- Mean = 57.5051
- Std.dev = 79.0636
- 1309 items above graph maximum of 320
|
