Data
457,988 items of data are available, covering 210,751 participants.
Defined-instances run from 0 to 4, labelled using Instancing
1.
Units of measurement are ug.
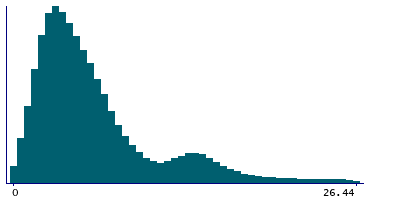
| Maximum | 114.2 |
| Decile 9 | 14.13 |
| Decile 8 | 9.25 |
| Decile 7 | 7.07 |
| Decile 6 | 5.86 |
| Median | 4.92 |
| Decile 4 | 4.1 |
| Decile 3 | 3.37 |
| Decile 2 | 2.65 |
| Decile 1 | 1.82 |
| Minimum | 0 |
|
|
- Mean = 6.55144
- Std.dev = 5.58081
- 4475 items above graph maximum of 26.44
|
5 Instances
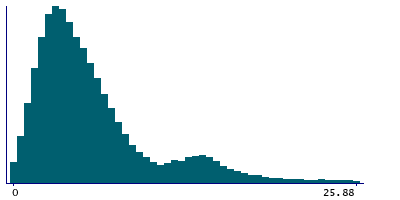
Instance 0 : Conducted in assessment centre, April 2009 to September 2010.
70,663 participants, 70,663 items
| Maximum | 97.51 |
| Decile 9 | 13.81 |
| Decile 8 | 8.82 |
| Decile 7 | 6.88 |
| Decile 6 | 5.71 |
| Median | 4.79 |
| Decile 4 | 3.99 |
| Decile 3 | 3.29 |
| Decile 2 | 2.57 |
| Decile 1 | 1.74 |
| Minimum | 0 |
|
|
- Mean = 6.35378
- Std.dev = 5.46684
- 747 items above graph maximum of 25.88
|
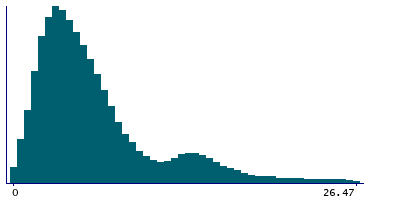
Instance 1 : On-line cycle 1, February 2011 to April 2011.
100,445 participants, 100,445 items
| Maximum | 95.25 |
| Decile 9 | 14.17 |
| Decile 8 | 9.35 |
| Decile 7 | 7.18 |
| Decile 6 | 5.96 |
| Median | 5.02 |
| Decile 4 | 4.2 |
| Decile 3 | 3.45 |
| Decile 2 | 2.71 |
| Decile 1 | 1.87 |
| Minimum | 0 |
|
|
- Mean = 6.63392
- Std.dev = 5.58767
- 988 items above graph maximum of 26.47
|
Instance 2 : On-line cycle 2, June 2011 to September 2011.
83,139 participants, 83,139 items
| Maximum | 100.75 |
| Decile 9 | 14.19 |
| Decile 8 | 9.41 |
| Decile 7 | 7.08 |
| Decile 6 | 5.84 |
| Median | 4.88 |
| Decile 4 | 4.05 |
| Decile 3 | 3.32 |
| Decile 2 | 2.61 |
| Decile 1 | 1.79 |
| Minimum | 0 |
|

|
- Mean = 6.58641
- Std.dev = 5.70562
- 848 items above graph maximum of 26.59
|
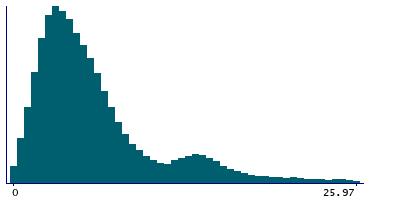
Instance 3 : On-line cycle 3, October 2011 to December 2011.
103,614 participants, 103,614 items
| Maximum | 99.6 |
| Decile 9 | 13.89 |
| Decile 8 | 8.98 |
| Decile 7 | 6.96 |
| Decile 6 | 5.81 |
| Median | 4.89 |
| Decile 4 | 4.1 |
| Decile 3 | 3.36 |
| Decile 2 | 2.65 |
| Decile 1 | 1.82 |
| Minimum | 0 |
|
|
- Mean = 6.45033
- Std.dev = 5.45328
- 1024 items above graph maximum of 25.96
|
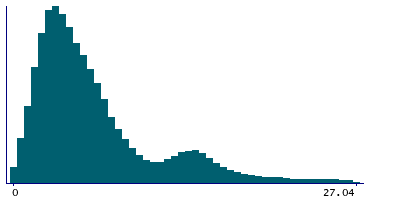
Instance 4 : On-line cycle 4, April 2012 to June 2012.
100,127 participants, 100,127 items
| Maximum | 114.2 |
| Decile 9 | 14.44 |
| Decile 8 | 9.64 |
| Decile 7 | 7.22 |
| Decile 6 | 5.96 |
| Median | 4.97 |
| Decile 4 | 4.13 |
| Decile 3 | 3.39 |
| Decile 2 | 2.68 |
| Decile 1 | 1.84 |
| Minimum | 0 |
|
|
- Mean = 6.6838
- Std.dev = 5.67278
- 899 items above graph maximum of 27.04
|

