Data
457,988 items of data are available, covering 210,751 participants.
Defined-instances run from 0 to 4, labelled using Instancing
1.
Units of measurement are g.
| Maximum | 687.72 |
| Decile 9 | 123.49 |
| Decile 8 | 103.87 |
| Decile 7 | 91.33 |
| Decile 6 | 81.64 |
| Median | 73.2 |
| Decile 4 | 65.3 |
| Decile 3 | 57.55 |
| Decile 2 | 49.17 |
| Decile 1 | 38.76 |
| Minimum | 0 |
|

|
- Mean = 78.1822
- Std.dev = 35.0107
- 1954 items above graph maximum of 208.22
|
5 Instances
Instance 0 : Conducted in assessment centre, April 2009 to September 2010.
70,663 participants, 70,663 items
| Maximum | 576.6 |
| Decile 9 | 123.225 |
| Decile 8 | 102.96 |
| Decile 7 | 89.97 |
| Decile 6 | 79.98 |
| Median | 71.3 |
| Decile 4 | 63.375 |
| Decile 3 | 55.46 |
| Decile 2 | 46.89 |
| Decile 1 | 36.47 |
| Minimum | 0 |
|
|
- Mean = 76.7529
- Std.dev = 36.2709
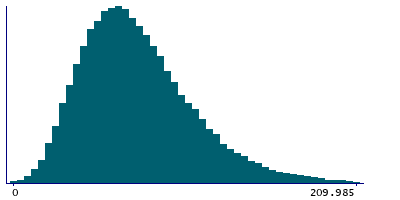
- 348 items above graph maximum of 209.98
|
Instance 1 : On-line cycle 1, February 2011 to April 2011.
100,445 participants, 100,445 items
| Maximum | 490.39 |
| Decile 9 | 123.275 |
| Decile 8 | 103.9 |
| Decile 7 | 91.46 |
| Decile 6 | 81.83 |
| Median | 73.45 |
| Decile 4 | 65.59 |
| Decile 3 | 57.96 |
| Decile 2 | 49.53 |
| Decile 1 | 39.25 |
| Minimum | 0 |
|

|
- Mean = 78.3443
- Std.dev = 34.6583
- 413 items above graph maximum of 207.3
|
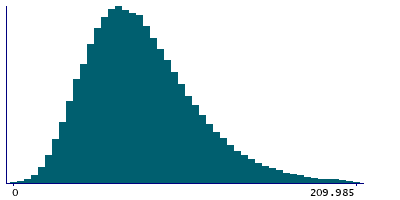
Instance 2 : On-line cycle 2, June 2011 to September 2011.
83,139 participants, 83,139 items
| Maximum | 687.72 |
| Decile 9 | 123.69 |
| Decile 8 | 103.69 |
| Decile 7 | 91.24 |
| Decile 6 | 81.63 |
| Median | 73.195 |
| Decile 4 | 65.22 |
| Decile 3 | 57.53 |
| Decile 2 | 49.13 |
| Decile 1 | 38.68 |
| Minimum | 0 |
|

|
- Mean = 78.1455
- Std.dev = 34.9738
- 343 items above graph maximum of 208.7
|
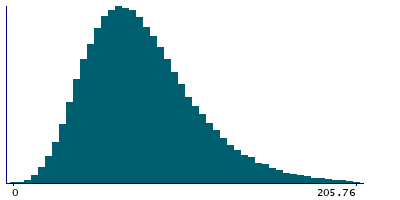
Instance 3 : On-line cycle 3, October 2011 to December 2011.
103,614 participants, 103,614 items
| Maximum | 499.93 |
| Decile 9 | 122.48 |
| Decile 8 | 103.18 |
| Decile 7 | 90.9 |
| Decile 6 | 81.335 |
| Median | 73.02 |
| Decile 4 | 65.25 |
| Decile 3 | 57.57 |
| Decile 2 | 49.34 |
| Decile 1 | 39.18 |
| Minimum | 0 |
|
|
- Mean = 77.8635
- Std.dev = 34.2191
- 398 items above graph maximum of 205.78
|
Instance 4 : On-line cycle 4, April 2012 to June 2012.
100,127 participants, 100,127 items
| Maximum | 553.05 |
| Decile 9 | 124.83 |
| Decile 8 | 105.15 |
| Decile 7 | 92.68 |
| Decile 6 | 82.87 |
| Median | 74.49 |
| Decile 4 | 66.49 |
| Decile 3 | 58.73 |
| Decile 2 | 50.32 |
| Decile 1 | 39.655 |
| Minimum | 0 |
|
|
- Mean = 79.3885
- Std.dev = 35.2535
- 443 items above graph maximum of 210.005
|

