Data
457,988 items of data are available, covering 210,751 participants.
Defined-instances run from 0 to 4, labelled using Instancing
1.
Units of measurement are g.
| Maximum | 18784.5 |
| Decile 9 | 4281.5 |
| Decile 8 | 3823 |
| Decile 7 | 3531.5 |
| Decile 6 | 3301 |
| Median | 3097 |
| Decile 4 | 2905.5 |
| Decile 3 | 2710 |
| Decile 2 | 2489.5 |
| Decile 1 | 2200.75 |
| Minimum | 0 |
|
|
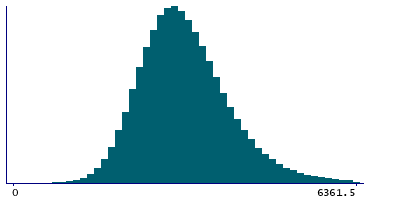
- Mean = 3189.73
- Std.dev = 863.358
- 1801 items above graph maximum of 6362.25
|
5 Instances
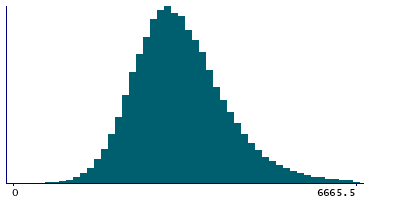
Instance 0 : Conducted in assessment centre, April 2009 to September 2010.
70,663 participants, 70,663 items
| Maximum | 18784.5 |
| Decile 9 | 4433.25 |
| Decile 8 | 3944.38 |
| Decile 7 | 3633.88 |
| Decile 6 | 3383 |
| Median | 3163.5 |
| Decile 4 | 2956 |
| Decile 3 | 2747 |
| Decile 2 | 2509.12 |
| Decile 1 | 2200 |
| Minimum | 0 |
|
|
- Mean = 3263.45
- Std.dev = 939.201
- 304 items above graph maximum of 6666.5
|
Instance 1 : On-line cycle 1, February 2011 to April 2011.
100,445 participants, 100,445 items
| Maximum | 13842 |
| Decile 9 | 4259.5 |
| Decile 8 | 3810 |
| Decile 7 | 3523.5 |
| Decile 6 | 3297 |
| Median | 3095.62 |
| Decile 4 | 2906.25 |
| Decile 3 | 2713 |
| Decile 2 | 2494 |
| Decile 1 | 2209 |
| Minimum | 0 |
|

|
- Mean = 3184.1
- Std.dev = 843.934
- 363 items above graph maximum of 6310
|
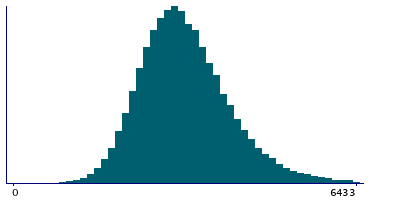
Instance 2 : On-line cycle 2, June 2011 to September 2011.
83,139 participants, 83,139 items
| Maximum | 15594.8 |
| Decile 9 | 4334.5 |
| Decile 8 | 3872 |
| Decile 7 | 3578 |
| Decile 6 | 3348.25 |
| Median | 3139 |
| Decile 4 | 2946.25 |
| Decile 3 | 2747 |
| Decile 2 | 2524 |
| Decile 1 | 2236 |
| Minimum | 0 |
|
|
- Mean = 3232.87
- Std.dev = 869.088
- 318 items above graph maximum of 6433
|
Instance 3 : On-line cycle 3, October 2011 to December 2011.
103,614 participants, 103,614 items
| Maximum | 13348.5 |
| Decile 9 | 4175.12 |
| Decile 8 | 3728.5 |
| Decile 7 | 3452 |
| Decile 6 | 3228 |
| Median | 3033 |
| Decile 4 | 2847.88 |
| Decile 3 | 2659 |
| Decile 2 | 2444 |
| Decile 1 | 2164 |
| Minimum | 0 |
|

|
- Mean = 3119.34
- Std.dev = 829.721
- 404 items above graph maximum of 6186.25
|
Instance 4 : On-line cycle 4, April 2012 to June 2012.
100,127 participants, 100,127 items
| Maximum | 16611.8 |
| Decile 9 | 4248.5 |
| Decile 8 | 3802.25 |
| Decile 7 | 3515.5 |
| Decile 6 | 3290.5 |
| Median | 3092 |
| Decile 4 | 2901 |
| Decile 3 | 2708.75 |
| Decile 2 | 2491.25 |
| Decile 1 | 2205.75 |
| Minimum | 0 |
|

|
- Mean = 3180.36
- Std.dev = 849.844
- 379 items above graph maximum of 6291.25
|

