Data
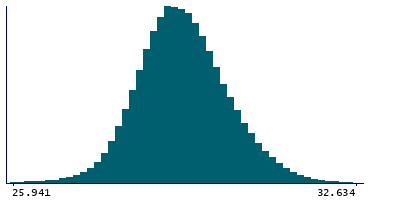
507,960 items of data are available, covering 488,512 participants.
Defined-instances run from 0 to 1, labelled using Instancing
2.
Units of measurement are percent.
| Maximum | 38.629 |
| Decile 9 | 30.3562 |
| Decile 8 | 29.922 |
| Decile 7 | 29.63 |
| Decile 6 | 29.3918 |
| Median | 29.1789 |
| Decile 4 | 28.9731 |
| Decile 3 | 28.7638 |
| Decile 2 | 28.5213 |
| Decile 1 | 28.179 |
| Minimum | 11.273 |
|

|
- Mean = 29.2186
- Std.dev = 0.895298
- 1196 items below graph minimum of 26.0018
- 290 items above graph maximum of 32.5333
|
2 Instances
Instance 0 : Initial assessment visit (2006-2010) at which participants were recruited and consent given
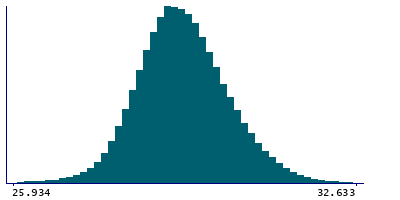
488,083 participants, 488,083 items
| Maximum | 38.629 |
| Decile 9 | 30.3539 |
| Decile 8 | 29.919 |
| Decile 7 | 29.627 |
| Decile 6 | 29.3889 |
| Median | 29.176 |
| Decile 4 | 28.9709 |
| Decile 3 | 28.761 |
| Decile 2 | 28.519 |
| Decile 1 | 28.1767 |
| Minimum | 11.273 |
|

|
- Mean = 29.2159
- Std.dev = 0.89532
- 1145 items below graph minimum of 25.9995
- 276 items above graph maximum of 32.5311
|
Instance 1 : First repeat assessment visit (2012-13)
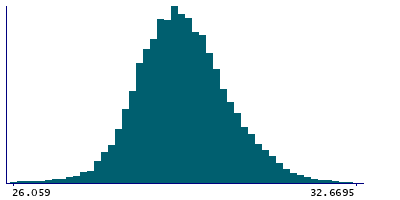
19,877 participants, 19,877 items
| Maximum | 33.277 |
| Decile 9 | 30.422 |
| Decile 8 | 29.9851 |
| Decile 7 | 29.7003 |
| Decile 6 | 29.462 |
| Median | 29.249 |
| Decile 4 | 29.045 |
| Decile 3 | 28.828 |
| Decile 2 | 28.58 |
| Decile 1 | 28.246 |
| Minimum | 23.858 |
|

|
- Mean = 29.2853
- Std.dev = 0.892167
- 51 items below graph minimum of 26.07
- 11 items above graph maximum of 32.598
|


