Data
259,237 items of data are available, covering 222,063 participants.
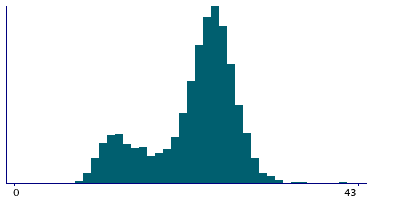
Defined-instances run from 0 to 3, labelled using Instancing
2.
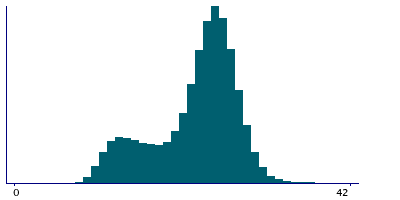
| Maximum | 95 |
| Decile 9 | 28 |
| Decile 8 | 27 |
| Decile 7 | 26 |
| Decile 6 | 25 |
| Median | 24 |
| Decile 4 | 23 |
| Decile 3 | 21 |
| Decile 2 | 18 |
| Decile 1 | 14 |
| Minimum | 3 |
|
|
- There are 63 distinct values.
- Mean = 22.5245
- Std.dev = 5.29948
- 218 items above graph maximum of 42
|
4 Instances
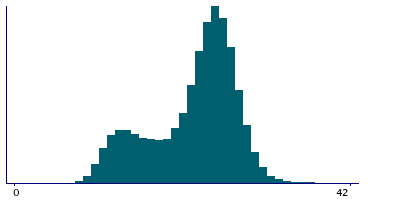
Instance 0 : Initial assessment visit (2006-2010) at which participants were recruited and consent given
170,692 participants, 170,692 items
| Maximum | 67 |
| Decile 9 | 28 |
| Decile 8 | 27 |
| Decile 7 | 26 |
| Decile 6 | 25 |
| Median | 24 |
| Decile 4 | 22 |
| Decile 3 | 20 |
| Decile 2 | 17 |
| Decile 1 | 14 |
| Minimum | 3 |
|
|
- There are 60 distinct values.
- Mean = 22.2847
- Std.dev = 5.41347
- 123 items above graph maximum of 42
|
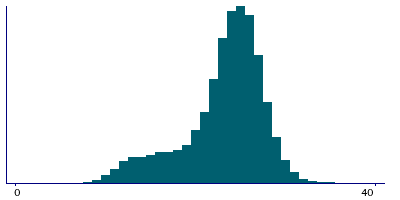
Instance 1 : First repeat assessment visit (2012-13)
20,227 participants, 20,227 items
| Maximum | 60 |
| Decile 9 | 28 |
| Decile 8 | 27 |
| Decile 7 | 26 |
| Decile 6 | 25 |
| Median | 24 |
| Decile 4 | 23 |
| Decile 3 | 22 |
| Decile 2 | 20 |
| Decile 1 | 16 |
| Minimum | 7 |
|
|
- There are 40 distinct values.
- Mean = 23.1104
- Std.dev = 4.52392
- 11 items above graph maximum of 40
|
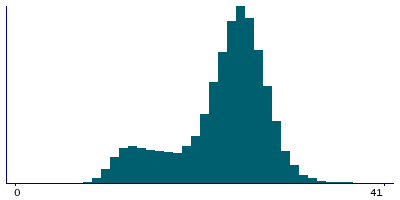
Instance 2 : Imaging visit (2014+)
62,796 participants, 62,796 items
| Maximum | 95 |
| Decile 9 | 28 |
| Decile 8 | 27 |
| Decile 7 | 26 |
| Decile 6 | 25 |
| Median | 24 |
| Decile 4 | 23 |
| Decile 3 | 22 |
| Decile 2 | 19 |
| Decile 1 | 15 |
| Minimum | 6 |
|
|
- There are 59 distinct values.
- Mean = 23.0295
- Std.dev = 5.13992
- 102 items above graph maximum of 41
|
Instance 3 : First repeat imaging visit (2019+)
5,522 participants, 5,522 items
| Maximum | 57 |
| Decile 9 | 28 |
| Decile 8 | 26 |
| Decile 7 | 25 |
| Decile 6 | 25 |
| Median | 24 |
| Decile 4 | 22 |
| Decile 3 | 21 |
| Decile 2 | 16 |
| Decile 1 | 13 |
| Minimum | 8 |
|
|
- There are 38 distinct values.
- Mean = 22.0503
- Std.dev = 5.57043
- 5 items above graph maximum of 43
|
Notes
position of the peak
A digital volume pulse can be considered to be the summation of a direct and a reflected component. The direct component is due to transmission of a pressure wave from the left ventricle to the finger via the most direct route. The reflected component is formed by pressure transmitted from the heart to the lower body where it is reflected back up the aorta and thence to the finger. This field is the time when the peak occurs in the waveform.


