Data
259,077 items of data are available, covering 221,939 participants.
Defined-instances run from 0 to 3, labelled using Instancing
2.
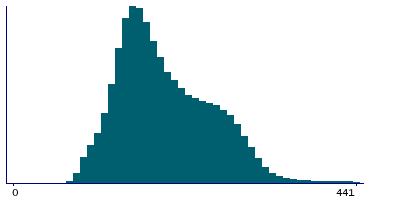
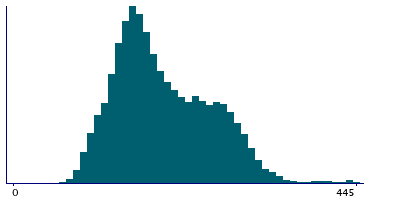
Units of measurement are milliseconds.
| Maximum | 7761 |
| Decile 9 | 284 |
| Decile 8 | 254 |
| Decile 7 | 227 |
| Decile 6 | 203 |
| Median | 184 |
| Decile 4 | 169 |
| Decile 3 | 156 |
| Decile 2 | 143 |
| Decile 1 | 127 |
| Minimum | 0 |
|
|
- There are 924 distinct values.
- Mean = 199.18
- Std.dev = 85.5854
- 2462 items above graph maximum of 441
|
4 Instances
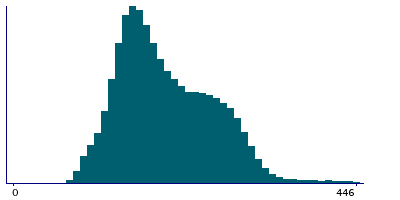
Instance 0 : Initial assessment visit (2006-2010) at which participants were recruited and consent given
170,596 participants, 170,596 items
| Maximum | 1614 |
| Decile 9 | 287 |
| Decile 8 | 258 |
| Decile 7 | 232 |
| Decile 6 | 208 |
| Median | 188 |
| Decile 4 | 172 |
| Decile 3 | 158 |
| Decile 2 | 145 |
| Decile 1 | 128 |
| Minimum | 0 |
|
|
- There are 827 distinct values.
- Mean = 201.856
- Std.dev = 73.0513
- 1597 items above graph maximum of 446
|
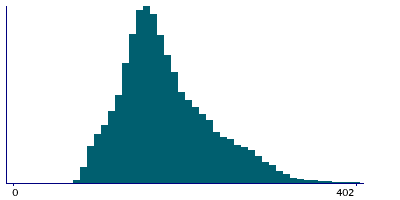
Instance 1 : First repeat assessment visit (2012-13)
20,218 participants, 20,218 items
| Maximum | 1327 |
| Decile 9 | 260 |
| Decile 8 | 224 |
| Decile 7 | 200 |
| Decile 6 | 182 |
| Median | 169 |
| Decile 4 | 158 |
| Decile 3 | 148 |
| Decile 2 | 136 |
| Decile 1 | 118 |
| Minimum | 62 |
|
|
- There are 431 distinct values.
- Mean = 181.806
- Std.dev = 65.2183
- 146 items above graph maximum of 402
|
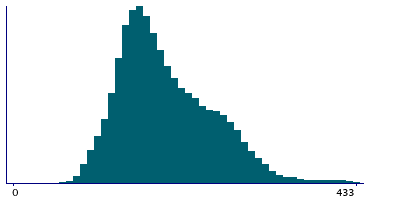
Instance 2 : Imaging visit (2014+)
62,742 participants, 62,742 items
| Maximum | 7761 |
| Decile 9 | 279 |
| Decile 8 | 247 |
| Decile 7 | 220 |
| Decile 6 | 198 |
| Median | 181 |
| Decile 4 | 167 |
| Decile 3 | 155 |
| Decile 2 | 143 |
| Decile 1 | 127 |
| Minimum | 0 |
|
|
- There are 660 distinct values.
- Mean = 197.365
- Std.dev = 117.43
- 698 items above graph maximum of 431
|
Instance 3 : First repeat imaging visit (2019+)
5,521 participants, 5,521 items
| Maximum | 1411 |
| Decile 9 | 287 |
| Decile 8 | 260 |
| Decile 7 | 235 |
| Decile 6 | 209 |
| Median | 188 |
| Decile 4 | 170 |
| Decile 3 | 157 |
| Decile 2 | 143 |
| Decile 1 | 125 |
| Minimum | 66 |
|
|
- There are 340 distinct values.
- Mean = 200.752
- Std.dev = 71.9534
- 31 items above graph maximum of 449
|
Notes
peak to peak time in milliseconds
A digital volume pulse can be considered to be the summation of a direct and a reflected component. The direct component is due to transmission of a pressure wave from the left ventricle to the finger via the most direct route. The reflected component is formed by pressure transmitted from the heart to the lower body where it is reflected back up the aorta and thence to the finger. peak to peak time is the difference between the peak values of direct and reflected components.


