Data
444,982 items of data are available, covering 431,570 participants.
Defined-instances run from 0 to 1, labelled using Instancing
2.
Units of measurement are g/L.
| Maximum | 117.36 |
| Decile 9 | 77.78 |
| Decile 8 | 75.79 |
| Decile 7 | 74.45 |
| Decile 6 | 73.34 |
| Median | 72.33 |
| Decile 4 | 71.36 |
| Decile 3 | 70.33 |
| Decile 2 | 69.15 |
| Decile 1 | 67.53 |
| Minimum | 36.27 |
|

|
- Mean = 72.5375
- Std.dev = 4.12056
- 107 items below graph minimum of 57.28
- 597 items above graph maximum of 88.03
|
2 Instances
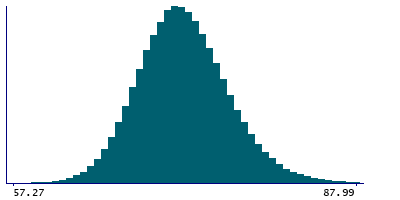
Instance 0 : Initial assessment visit (2006-2010) at which participants were recruited and consent given
429,305 participants, 429,305 items
| Maximum | 117.36 |
| Decile 9 | 77.75 |
| Decile 8 | 75.76 |
| Decile 7 | 74.42 |
| Decile 6 | 73.31 |
| Median | 72.31 |
| Decile 4 | 71.33 |
| Decile 3 | 70.3 |
| Decile 2 | 69.12 |
| Decile 1 | 67.51 |
| Minimum | 36.27 |
|
|
- Mean = 72.5104
- Std.dev = 4.11585
- 104 items below graph minimum of 57.27
- 566 items above graph maximum of 87.99
|
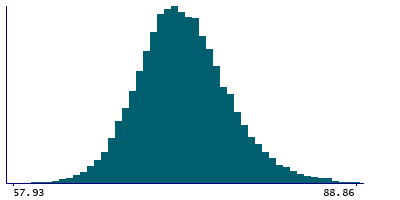
Instance 1 : First repeat assessment visit (2012-13)
15,677 participants, 15,677 items
| Maximum | 96.46 |
| Decile 9 | 78.55 |
| Decile 8 | 76.51 |
| Decile 7 | 75.18 |
| Decile 6 | 74.07 |
| Median | 73.03 |
| Decile 4 | 72.05 |
| Decile 3 | 71.05 |
| Decile 2 | 69.89 |
| Decile 1 | 68.24 |
| Minimum | 54.74 |
|
|
- Mean = 73.28
- Std.dev = 4.17976
- 6 items below graph minimum of 57.93
- 31 items above graph maximum of 88.86
|
Notes
Measured by biuret analysis on a Beckman Coulter AU5800
0 Related Data-Fields
There are no related data-fields

